DXU ETF Review
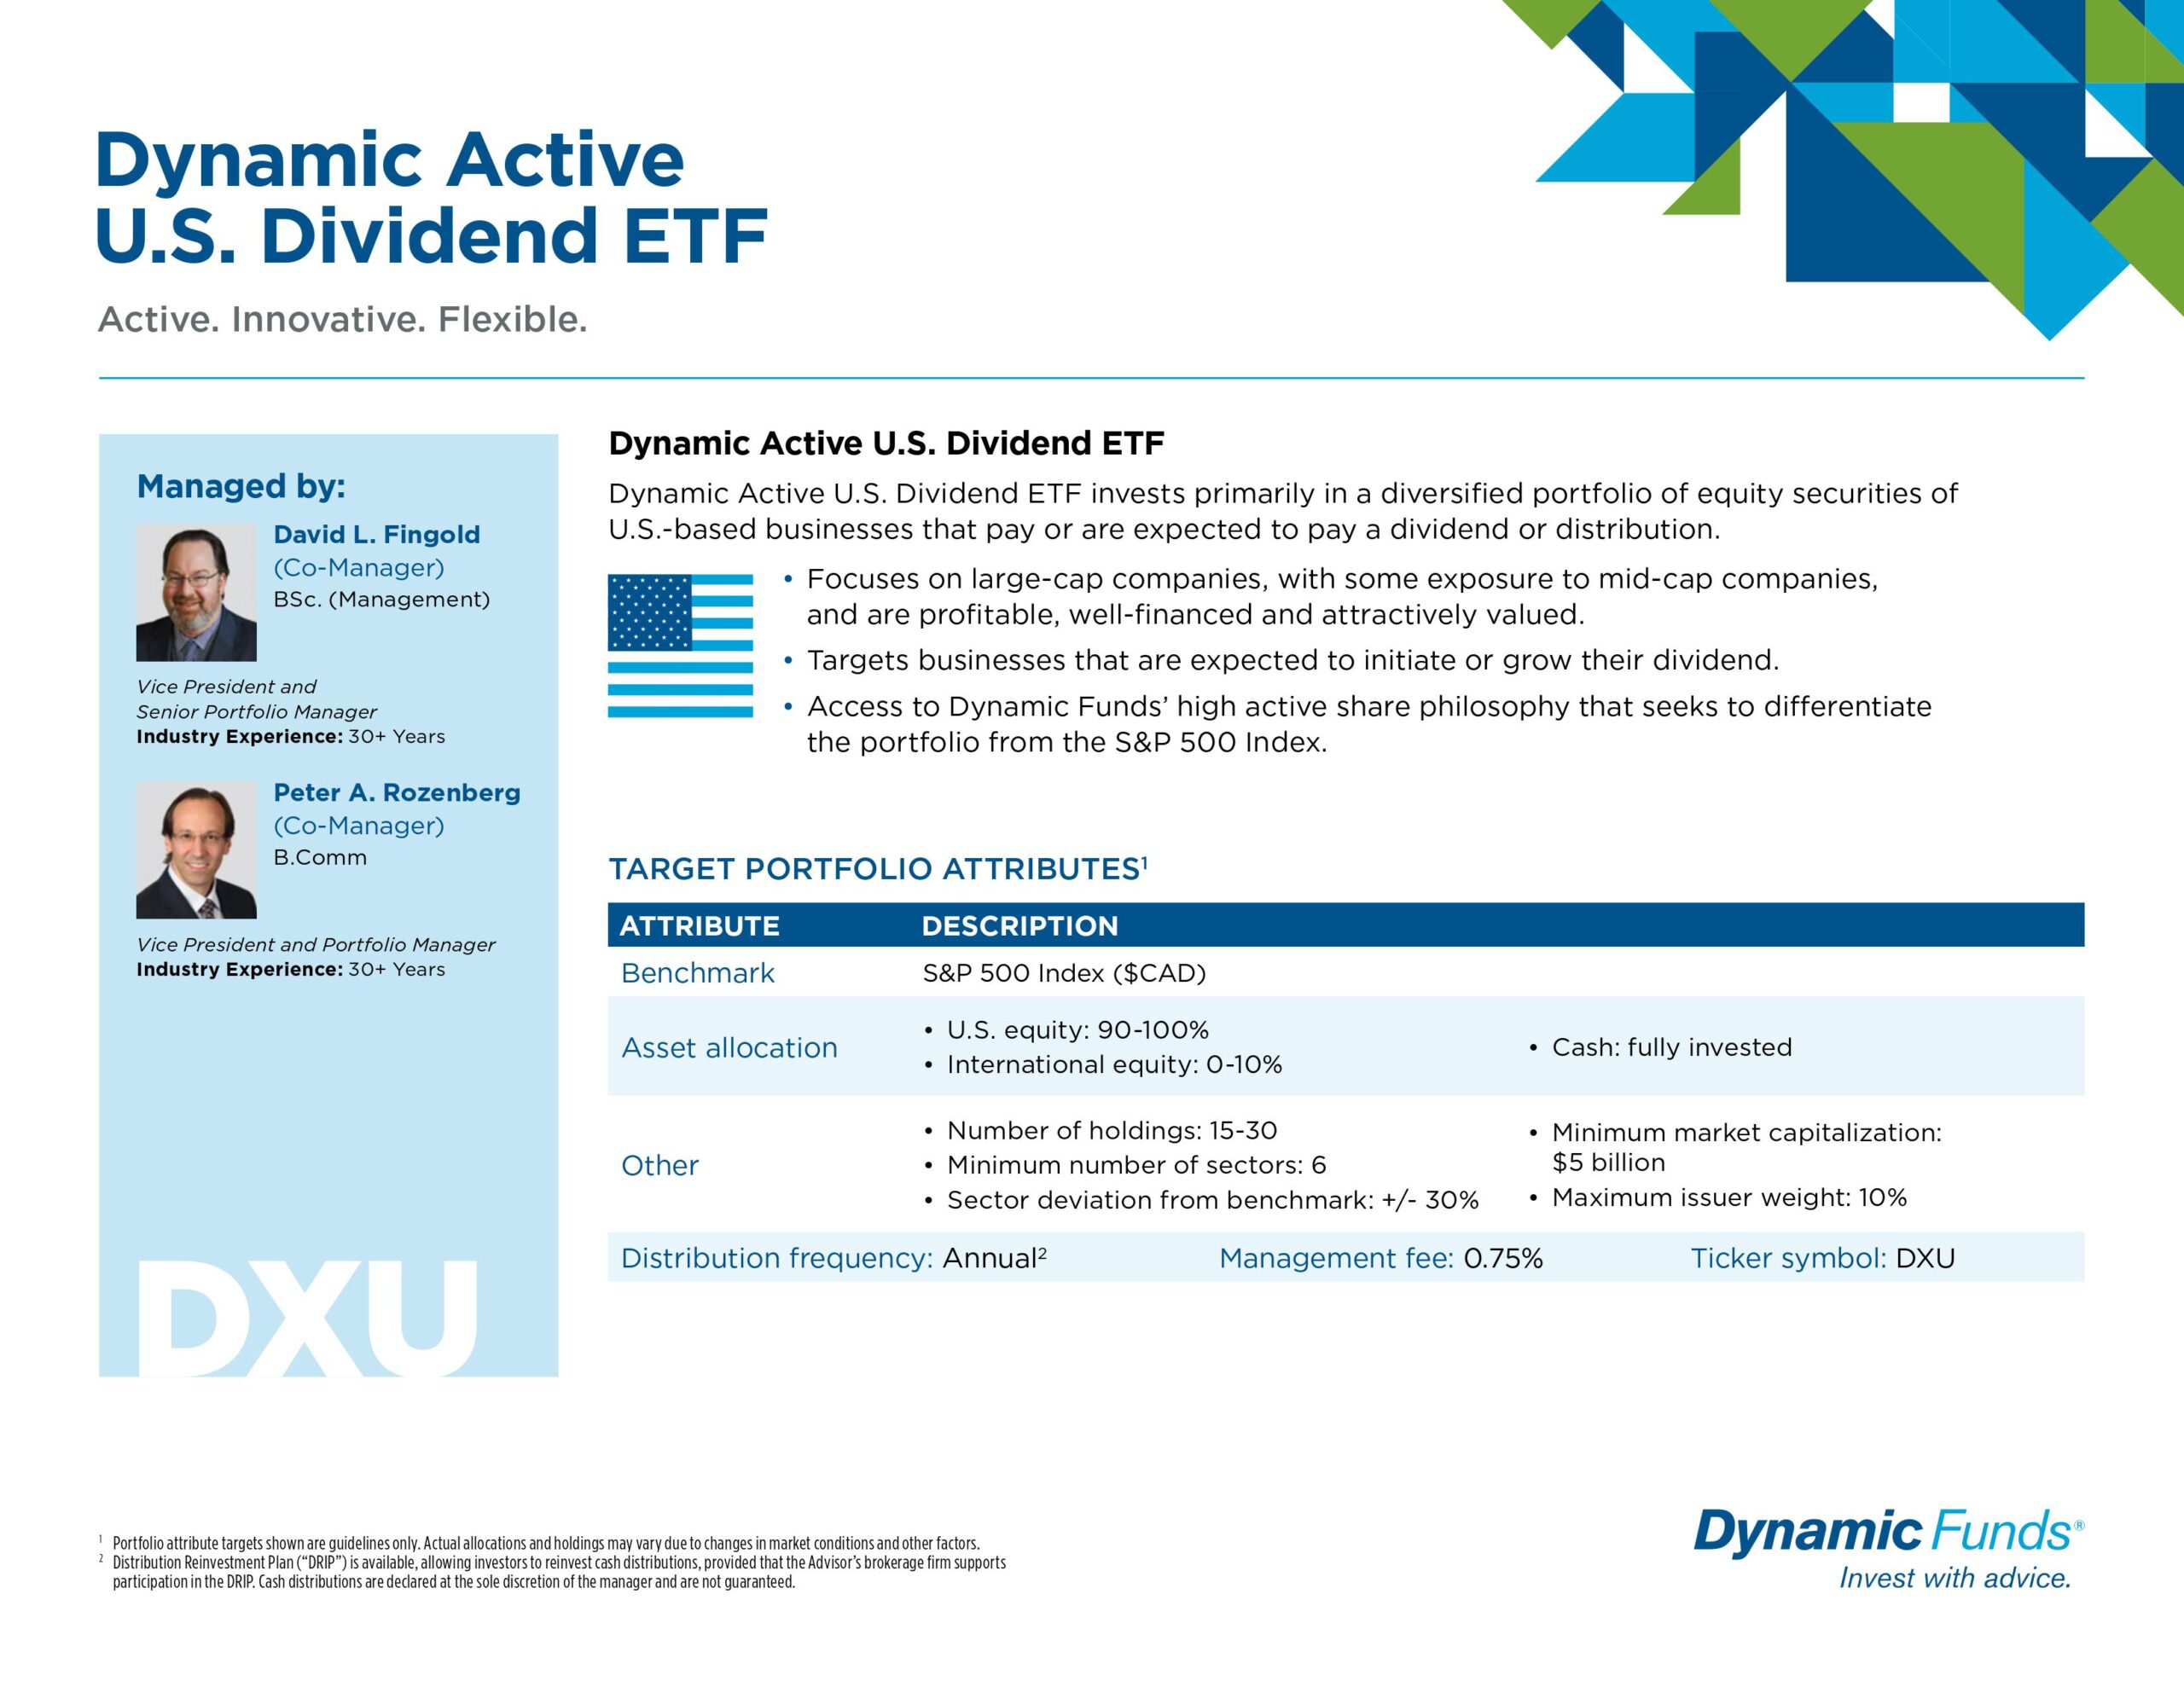
Dynamic Active U.S. Dividend ETF (DXU) invests primarily in a broadly diversified portfolio of equity securities of U.S. based businesses that pay or are expected to pay a dividend or distribution.
- Focuses on large cap companies, with some exposure to mid-cap companies, and are profitable, well-financedand attractively valued
- Targets businesses that are expected to initiate or grow their dividend
- Access to Dynamic Funds’ high active share philosophy that seeks to differentiate the portfolio from the S&P 500 Index

Top 10 DXU Holdings
The top 10 investments of DXU account for 54.6% of the 26 holdings. This table shows the investment names of the individual holdings that are subject to change.
| Name | Weight |
|---|---|
| Microsoft Corporation | 7.6% |
| Amazon.com, Inc. | 7.3% |
| NVIDIA Corporation | 7.3% |
| Alphabet Inc. | 5.9% |
| Western Digital Corporation | 5.3% |
| General Electric Company | 5.0% |
| Carlisle Companies Incorporated | 4.3% |
| Eli Lilly and Company | 4.1% |
| Progressive Corporation (The) | 4.1% |
| Uber Technologies, Inc. | 3.7% |

Is DXU a Good Investment?
Quickly compare DXU to similar investments focused on American equity ETFs by risk, fees, performance, yield, volatility, and other metrics to decide which ETF will fit into your portfolio.
| Manager | ETF | Risk | Inception | MER | AUM | Holdings | Beta | P/E | Yield | Distributions | 1Y | 3Y | 5Y | 10Y | 15Y |
|---|---|---|---|---|---|---|---|---|---|---|---|---|---|---|---|
| QUS | Medium | 2017-01-30 | 0.45% | $126,642,949 | 143 | 0.92 | 22.84 | 0.99% | Annually | 18.02% | 9.55% | 11.91% | N/A | N/A | |
| XSP | Medium | 2001-05-24 | 0.09% | $10,482,958,222 | 503 | 1.18 | 27.64 | 1.09% | Semi-Annually | 23.02% | 8.64% | 13.36% | 11.42% | 13.54% | |
| ZLU | Medium | 2013-03-19 | 0.33% | $1,510,840,000 | 101 | 0.39 | N/A | 2.23% | Quarterly | 8.68% | 8.73% | 8.47% | 12.04% | N/A | |
| KNGU | Medium to High | 2024-05-30 | N/A | N/A | 50 | N/A | N/A | N/A | Monthly | N/A | N/A | N/A | N/A | N/A | |
| UMI.B | Medium | 2017-09-19 | 0.38% | $9,660,000 | 334 | 0.87 | 13.14 | 1.78% | Quarterly | 17.33% | 9.48% | 8.47% | N/A | N/A | |
| CUEI | Medium | 2021-03-31 | 0.06% | $284,043,239 | N/A | 0.96 | 25.07 | 1.35% | Quarterly | 22.13% | N/A | N/A | N/A | N/A | |
 | DRMU | Medium | 2018-09-27 | 0.23% | $247,370,000 | 545 | 1.02 | 29.72 | 0.96% | Quarterly | 25.58% | 11.83% | 15.56% | N/A | N/A |
 | DXU | Medium | 2017-01-20 | 0.80% | $128,280,000 | 27 | 0.82 | N/A | N/A | Annually | 17.37% | 5.42% | 11.65% | N/A | N/A |
| ESPX.B | Medium | 2023-01-09 | 0.69% | $95,756,000 | 505 | N/A | N/A | 8.25% | Monthly | 19.37% | N/A | N/A | N/A | N/A | |
 | FCUD | Medium | 2018-09-13 | 0.38% | $243,800,000 | 106 | 0.73 | 17.50 | 2.35% | Monthly | 20.00% | 11.80% | 10.84% | N/A | N/A |
 | FDL | Medium | 2016-09-29 | 0.61% | $9,407,194 | 1 | 0.78 | 12.20 | 3.35% | Quarterly | 14.66% | 7.27% | 9.16% | N/A | N/A |
| FLUS | Medium | 2017-05-31 | 0.29% | $63,580,000 | 210 | 0.92 | 19.93 | 1.19% | Quarterly | 22.80% | 13.21% | 12.85% | N/A | N/A | |
| QQCC | Medium | 2011-09-13 | 0.85% | $176,085,766 | 2 | N/A | 33.72 | N/A | Monthly | 24.55% | 12.82% | 9.60% | 4.40% | N/A | |
| GIQU.B | Medium | 2020-11-08 | 0.71% | $10,041,120 | 39 | 1.20 | 32.22 | 0.18% | Quarterly | 33.19% | 7.65% | N/A | N/A | N/A | |
| SMAX | Low to Medium | 2023-10-25 | N/A | $316,600,000 | 25 | N/A | N/A | N/A | Monthly | N/A | N/A | N/A | N/A | N/A | |
| IUAE | Medium | 2023-02-23 | 0.34% | $1,109,281 | 86 | N/A | N/A | 1.61% | Monthly | 12.94% | N/A | N/A | N/A | N/A | |
| QUU | Medium | 2020-09-30 | 0.07% | $2,759,704,642 | 499 | 0.97 | 25.32 | 1.17% | Quarterly | 23.00% | 11.66% | 14.82% | N/A | N/A | |
| MULC.B | Medium | 2017-04-17 | 0.36% | $64,470,000 | 747 | 0.92 | N/A | 0.98% | Semi-Annually | 16.62% | 11.07% | 13.17% | N/A | N/A | |
| NUSA | Medium | 2021-01-28 | 0.63% | $43,300,000 | 27 | 0.94 | 32.46 | 0.39% | Quarterly | 23.79% | 14.42% | N/A | N/A | N/A | |
| RUD | Medium | 2014-01-09 | 0.43% | $511,270,000 | 84 | 0.93 | 15.08 | 1.70% | Monthly | 19.23% | 14.27% | 13.60% | 13.23% | N/A | |
| SRIU | Medium | 2022-01-13 | 0.19% | $94,780,000 | 264 | N/A | N/A | 0.82% | Quarterly | 33.22% | N/A | N/A | N/A | N/A | |
| TPU | Medium | 2016-03-22 | 0.07% | $1,983,250,000 | 498 | 0.97 | N/A | 1.18% | Quarterly | 25.29% | 11.24% | 13.47% | N/A | N/A | |
| VUN | Medium | 2013-08-02 | 0.17% | $8,730,000,000 | 3,704 | 0.96 | 26.57 | 1.03% | Quarterly | 26.86% | 11.12% | 14.62% | 14.47% | N/A |