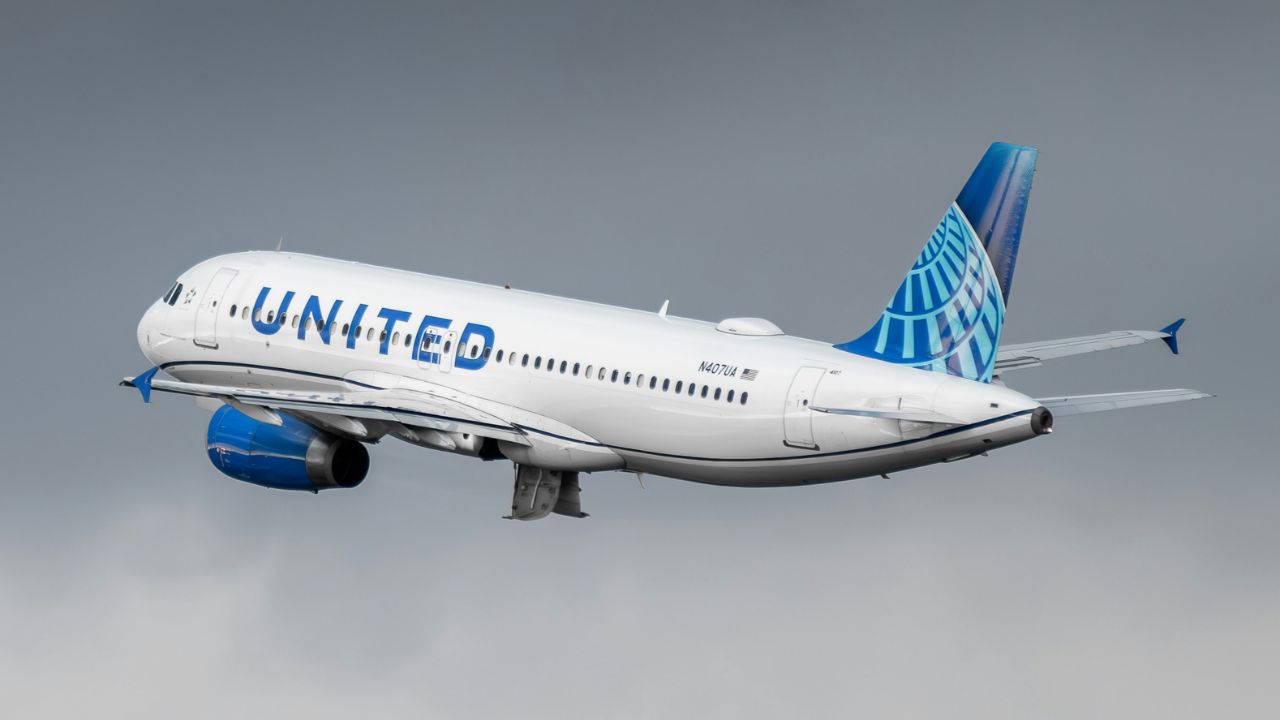
UAL Stock Analysis
United Airlines Holdings, Inc. (UAL) provides air transportation services in North America, Asia, Europe, Africa, the Pacific, the Middle East, and Latin America. The company transports people and cargo through its mainline and regional fleets. It also offers catering, ground handling, flight academy, and maintenance services for third parties. The company was formerly known as United Continental Holdings, Inc. and changed its name to United Airlines Holdings, Inc. in June 2019. United Airlines Holdings, Inc. was incorporated in 1968 and is headquartered in Chicago, Illinois.
- Sector: Industrials
- Industry: Airlines
- Earnings Date: Oct 15, 2024 – Oct 21, 2024
- Dividend: N/A
- Ex-Dividend Date: N/A
Is UAL a Good Investment?
Quickly compare UAL to similar investments focused on the industrial sector by performance, yield, volatility, and other metrics to decide which stock will fit into your portfolio.
| Ticker | Name | Market Cap | Beta | P/E | Yield | EV/EBITDA | P/B | P/S | C/S | Current | Margin | ROIC | REV Y/Y | 1Y |
|---|---|---|---|---|---|---|---|---|---|---|---|---|---|---|
| BLDR | Builders FirstSource, Inc. | $20,003,000,000 | 2.04 | 13.83 | N/A | 8.43 | 2.03 | 0.56 | 1.11 | 2.21 | 35.17% | 20.63% | -18.27% | 18.13% |
| CAT | Caterpillar Inc. | $174,118,000,000 | 1.11 | 16.07 | 1.58% | 10.41 | 6.30 | 1.84 | 20.31 | 1.35 | 34.69% | 16.09% | 8.59% | 34.96% |
| CMI | Cummins Inc. | $39,974,000,000 | 0.99 | 21.46 | 2.49% | 11.36 | 3.81 | 0.99 | 22.78 | 1.34 | 24.22% | 6.32% | 12.85% | 9.62% |
| CSX | CSX Corporation | $67,817,000,000 | 1.20 | 18.96 | 1.38% | 11.67 | 5.66 | 4.69 | 0.73 | 1.15 | 48.70% | 13.52% | -3.39% | 2.91% |
| DAL | Delta Air Lines, Inc. | $28,289,000,000 | 1.35 | 6.29 | 1.37% | 4.99 | 1.98 | 0.37 | 7.68 | 0.40 | 46.44% | 8.83% | 7.84% | -10.18% |
| DE | Deere & Company | $104,893,000,000 | 0.94 | 11.47 | 1.54% | 7.95 | 6.14 | 2.28 | 14.33 | 1.98 | 38.43% | 15.98% | -1.75% | -11.80% |
| DOV | Dover Corporation | $24,895,000,000 | 1.22 | 17.39 | 1.13% | 16.92 | 3.80 | 2.29 | 3.72 | 1.31 | 36.56% | 12.60% | -0.96% | 18.57% |
| FDX | FedEx Corporation | $74,832,000,000 | 1.19 | 17.80 | 1.80% | 7.43 | 1.63 | 0.51 | 44.41 | 1.36 | 61.81% | 7.56% | -2.73% | 16.23% |
| GD | General Dynamics Corporation | $79,077,000,000 | 0.60 | 23.53 | 1.97% | 17.35 | 3.21 | 1.59 | 8.06 | 1.44 | 15.78% | 8.13% | 8.09% | 33.39% |
| GWW | W.W. Grainger, Inc. | $46,756,000,000 | 1.17 | 26.25 | 0.86% | 16.81 | 9.34 | 1.75 | 21.58 | 2.19 | 39.42% | 33.33% | 6.06% | 23.71% |
| ITW | Illinois Tool Works Inc. | $72,398,000,000 | 1.11 | 23.93 | 2.31% | 18.39 | 22.87 | 4.29 | 3.75 | 1.32 | 42.16% | 26.43% | 0.31% | -5.04% |
| LMT | Lockheed Martin Corporation | $113,258,000,000 | 0.46 | 17.42 | 2.65% | 12.92 | 18.54 | 1.82 | 5.42 | 1.30 | 12.55% | 17.12% | 5.28% | 4.45% |
| MAS | Masco Corporation | $16,043,000,000 | 1.24 | 17.86 | 1.59% | 12.32 | N/A | 1.50 | 3.90 | 1.74 | 35.60% | 25.66% | -6.43% | 20.31% |
| OC | Owens Corning | $15,588,000,000 | 1.41 | 14.39 | 1.35% | 6.93 | 1.81 | 0.97 | 30.69 | 1.76 | 27.73% | 15.28% | -1.03% | 38.03% |
| PAYX | Paychex, Inc. | $44,551,000,000 | 0.99 | 26.32 | 3.19% | 18.50 | 11.63 | 8.38 | 4.31 | 1.37 | 71.97% | 21.20% | 5.42% | 0.24% |
| PCAR | PACCAR Inc | $57,163,000,000 | 0.92 | 11.33 | 1.10% | 8.17 | 2.25 | 1.01 | 24.58 | 2.45 | 23.44% | 16.79% | 14.85% | 10.24% |
| PH | Parker-Hannifin Corporation | $70,010,000,000 | 1.44 | 25.57 | 1.20% | 16.22 | 3.60 | 1.88 | 7.08 | 0.87 | 33.72% | 11.64% | 9.26% | 35.21% |
| ROK | Rockwell Automation, Inc. | $31,434,000,000 | 1.37 | 26.95 | 1.81% | 18.67 | 8.68 | 3.44 | 9.56 | 1.11 | 41.01% | 17.17% | 7.52% | -19.26% |
| SNA | Snap-on Incorporated | $14,476,000,000 | 0.98 | 14.27 | 2.71% | 9.97 | 2.47 | 2.45 | 35.02 | 4.06 | 51.28% | 18.72% | 2.31% | -0.28% |
| TXT | Textron Inc. | $17,569,000,000 | 1.25 | 19.69 | 0.09% | 13.74 | 2.15 | 1.09 | 13.32 | 1.66 | 16.65% | 7.02% | 7.00% | 36.23% |
| UAL | United Airlines Holdings, Inc. | $15,856,000,000 | 1.45 | 5.40 | N/A | 3.54 | 1.34 | 0.22 | 56.61 | 0.77 | 60.79% | 7.72% | 9.34% | -16.30% |
| UHAL | U-Haul Holding Company | $12,278,000,000 | 1.11 | 21.51 | N/A | 10.23 | 0.17 | 0.22 | 70.39 | 3.09 | 37.16% | 5.90% | -4.08% | 6.76% |
| UNP | Union Pacific Corporation | $148,266,000,000 | 1.07 | 23.21 | 2.21% | 14.69 | 9.23 | 5.66 | 1.91 | 0.93 | 73.24% | 14.44% | -3.90% | 14.29% |
| UPS | United Parcel Service, Inc. | $123,851,000,000 | 0.98 | 20.95 | 4.50% | 9.89 | 8.88 | 1.71 | 5.82 | 1.10 | 37.65% | 13.18% | -9.25% | -21.57% |
| URI | United Rentals, Inc. | $49,595,000,000 | 1.71 | 20.04 | 0.88% | 8.88 | 3.19 | 1.78 | 10.35 | 0.89 | 40.56% | 15.45% | 17.17% | 65.16% |


