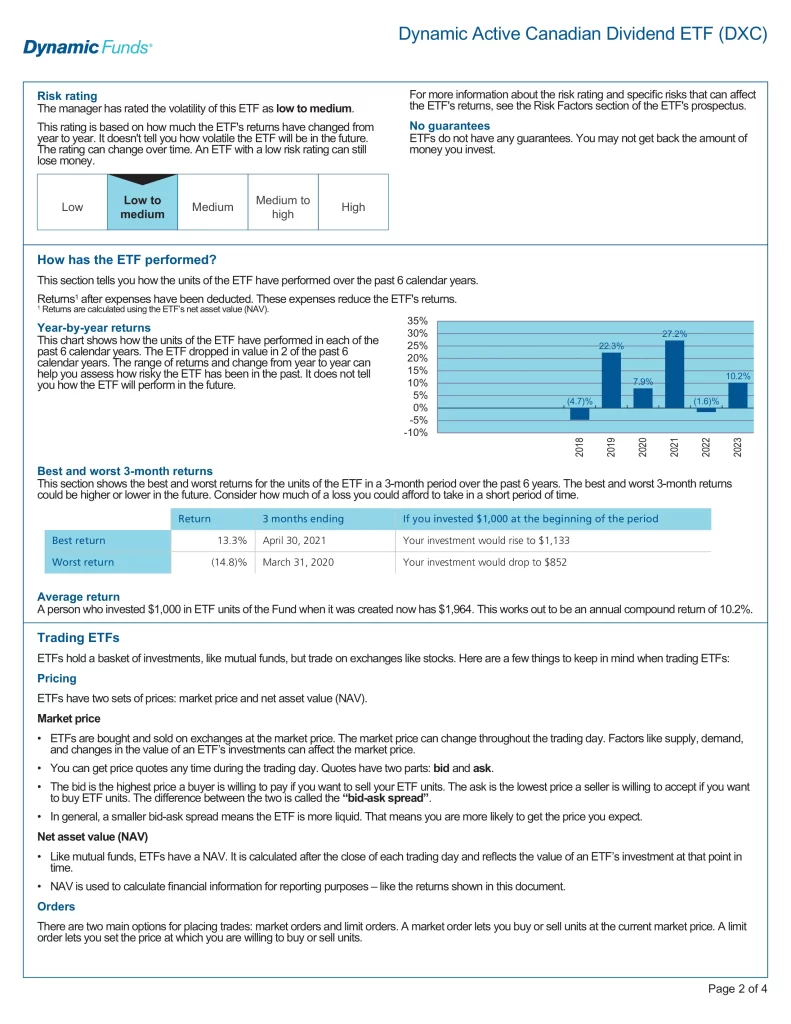
More information about Dynamic Active Canadian Dividend ETF (DXC) is in its prospectus. Before investing in an Exchange Traded Fund (ETF), it’s important to assess how it fits within your portfolio and aligns with your risk tolerance. ETF prices can also experience higher volatility during market openings and closings and there is always the possibility of losing money. It’s also worth noting that a narrower bid-ask spread generally indicates higher liquidity, meaning you’re more likely to execute trades at expected prices. Always consider these factors carefully when making investment decisions, as even ETFs considered low-risk can experience losses under certain market conditions.

DXC ETF Review
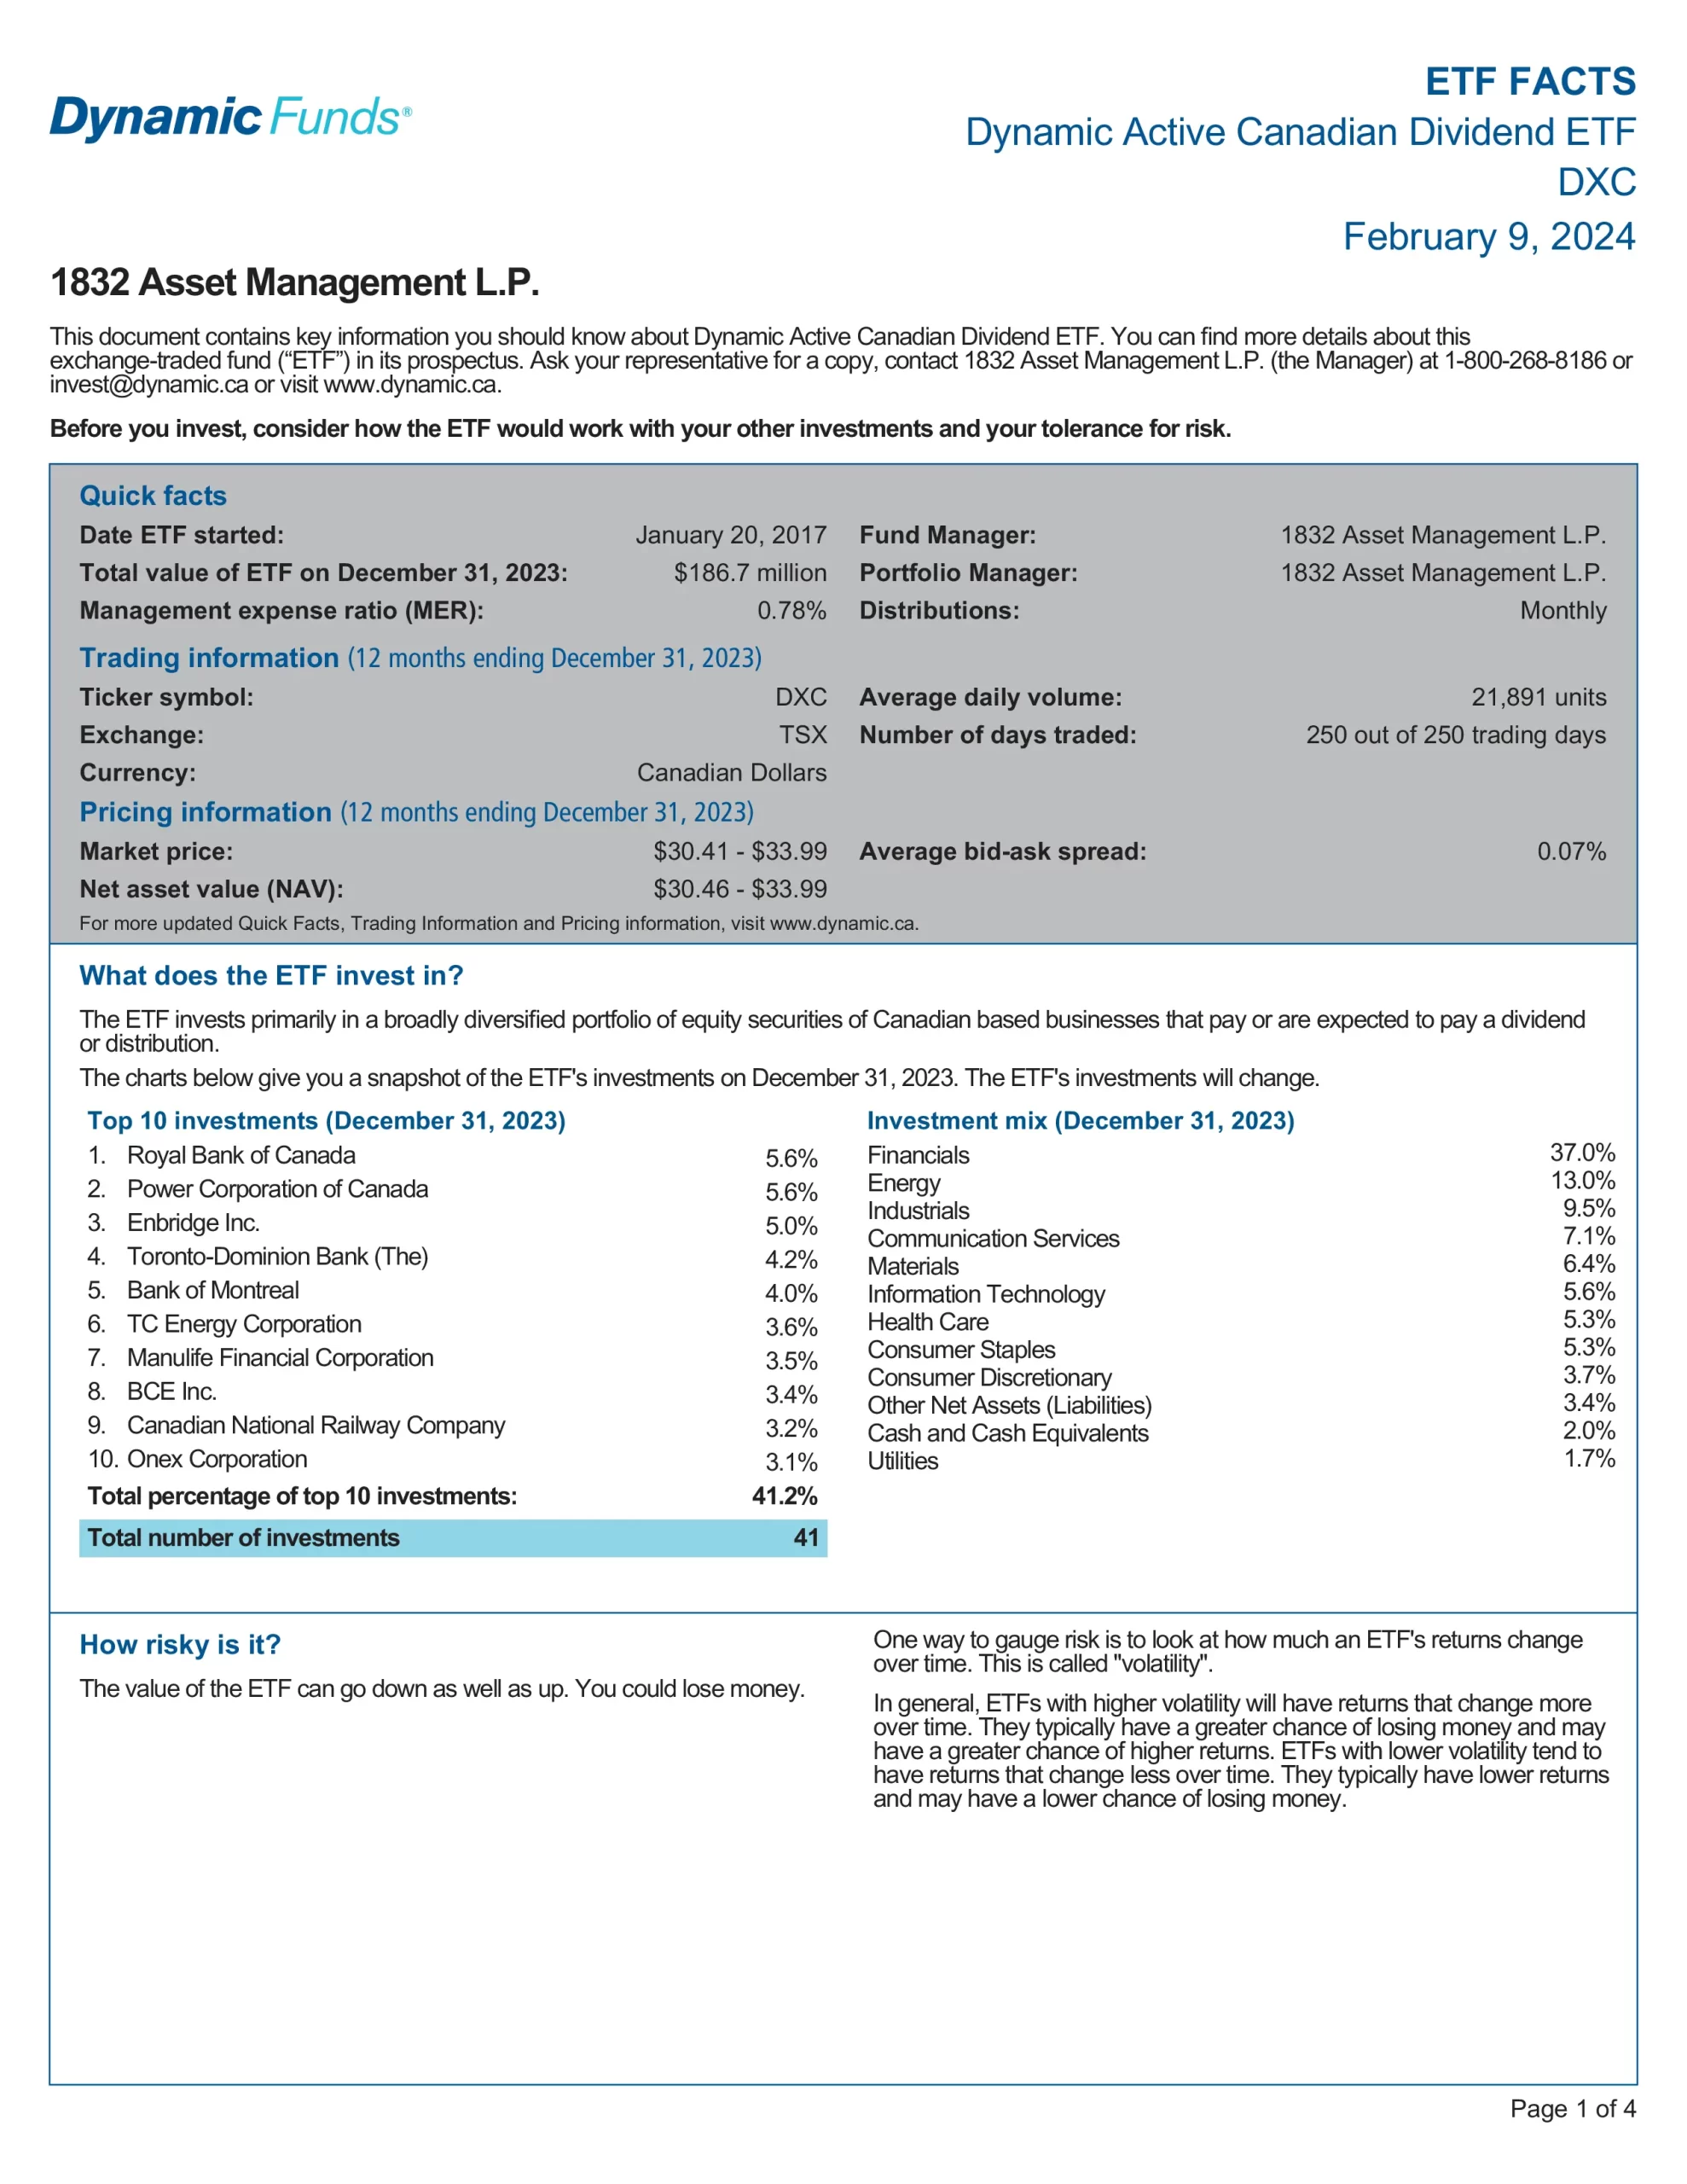
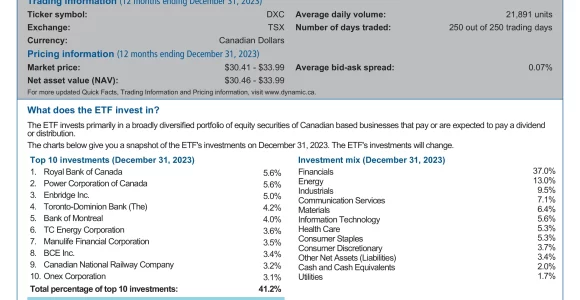
Dynamic Active Canadian Dividend ETF (DXC) invests primarily in a diversified portfolio of equity securities of Canadian-based businesses that pay or are expected to pay a dividend or distribution.
- Target companies that are attractively valued, have high margins and market share and are run by quality management teams
- Utilizes a bottom-up approach and fundamental analysis to assess growth and value potential
- Has the flexibility to access businesses located outside Canada
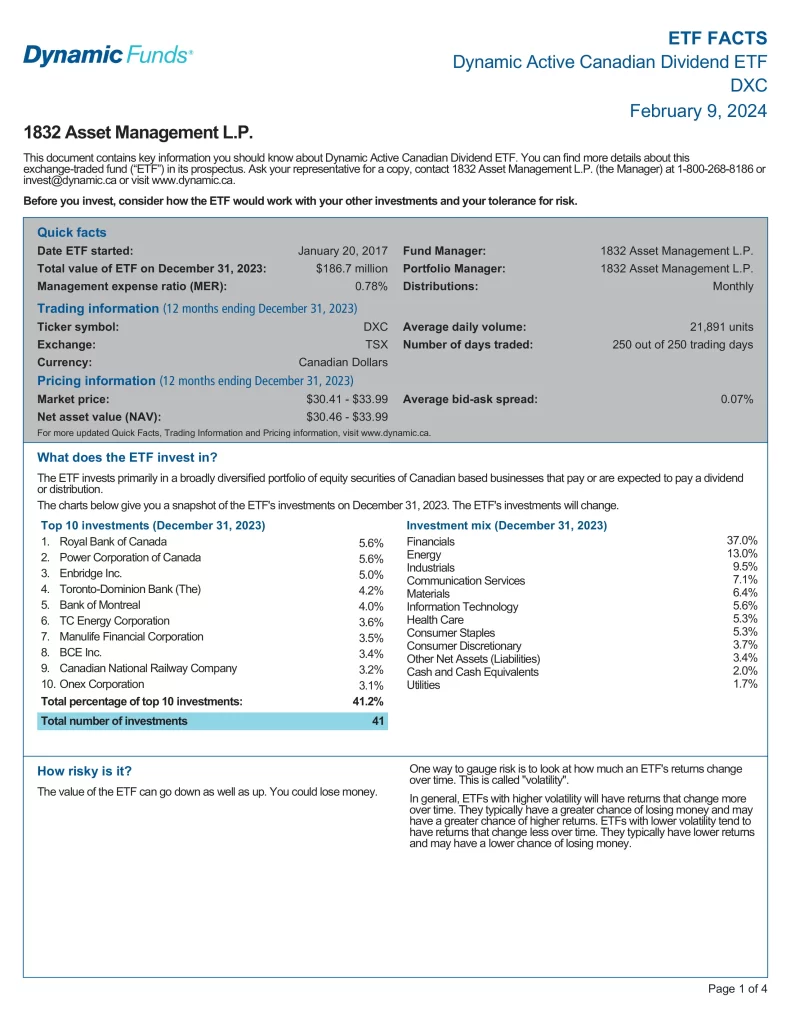
Top 10 DXC Holdings
Total percentage of top 10 investments: 41.2%. This table shows the investment names of the individual holdings that are subject to change.
| Ticker | Name | Weight |
|---|---|---|
| RY | Royal Bank of Canada | 5.7% |
| POW | Power Corporation of Canada | 5.5% |
| ENB | Enbridge Inc. | 5.1% |
| MFC | Manulife Financial Corporation | 4.0% |
| TRP | TC Energy Corporation | 3.8% |
| BMO | Bank of Montreal | 3.6% |
| TD | Toronto-Dominion Bank | 3.6% |
| CNR | Canadian National Railway Company | 3.4% |
| ONEX | Onex Corporation | 3.0% |
| QSR | Restaurant Brands International Inc. | 2.9% |
Is DXC a Good ETF?
Quickly compare and contrast DXC to other investments focused on Canadian equities by fees, performance, yield, and other metrics to decide which ETF fits in your portfolio.
| ETF | XCG | ZLB | QXM | DXC | PXC | VDY |
| Inception | 2006-11-06 | 2011-10-21 | 2012-02-02 | 2017-01-20 | 2012-01-10 | 2012-11-02 |
| AUM | $77,589,708 | $3,044,690,000 | $65,250,000 | $124,800,000 | $189,385,315 | $20,500,000,000 |
| Holdings | 40 | 47 | 68 | 40 | 103 | 47 |
| MER | 0.55% | 0.39% | 0.57% | 0.84% | 0.48% | 0.22% |
| Yield | 1.48% | 2.64% | 1.28% | 2.5% | 3.76% | 4.35% |
| P/E | 20.31 | 20.30 | N/A | N/A | 13.83 | 11.9 |
| P/B | 2.73 | 2.55 | N/A | N/A | 1.98 | 1.7 |
| Beta | 0.91 | 0.71 | 1.00 | 0.72 | 1.02 | 0.88 |
| 1Y | -3.23% | 3.14% | 2.4% | -2.7% | -5.30% | -7.94% |
| 3Y | 13.33% | 16.62% | 18.6% | 18.1% | 22.71% | 19.32% |
| 5Y | 10.06% | 10.10% | 7.7% | 11.0% | 8.95% | 9.50% |
| 10Y | 8.16% | 11.32% | 10.4% | N/A | 8.00% | 8.56% |