VGT ETF Review
Vanguard Information Technology ETF (VGT) seeks to track the performance of a benchmark index that measures the investment return of stocks in the information technology sector.
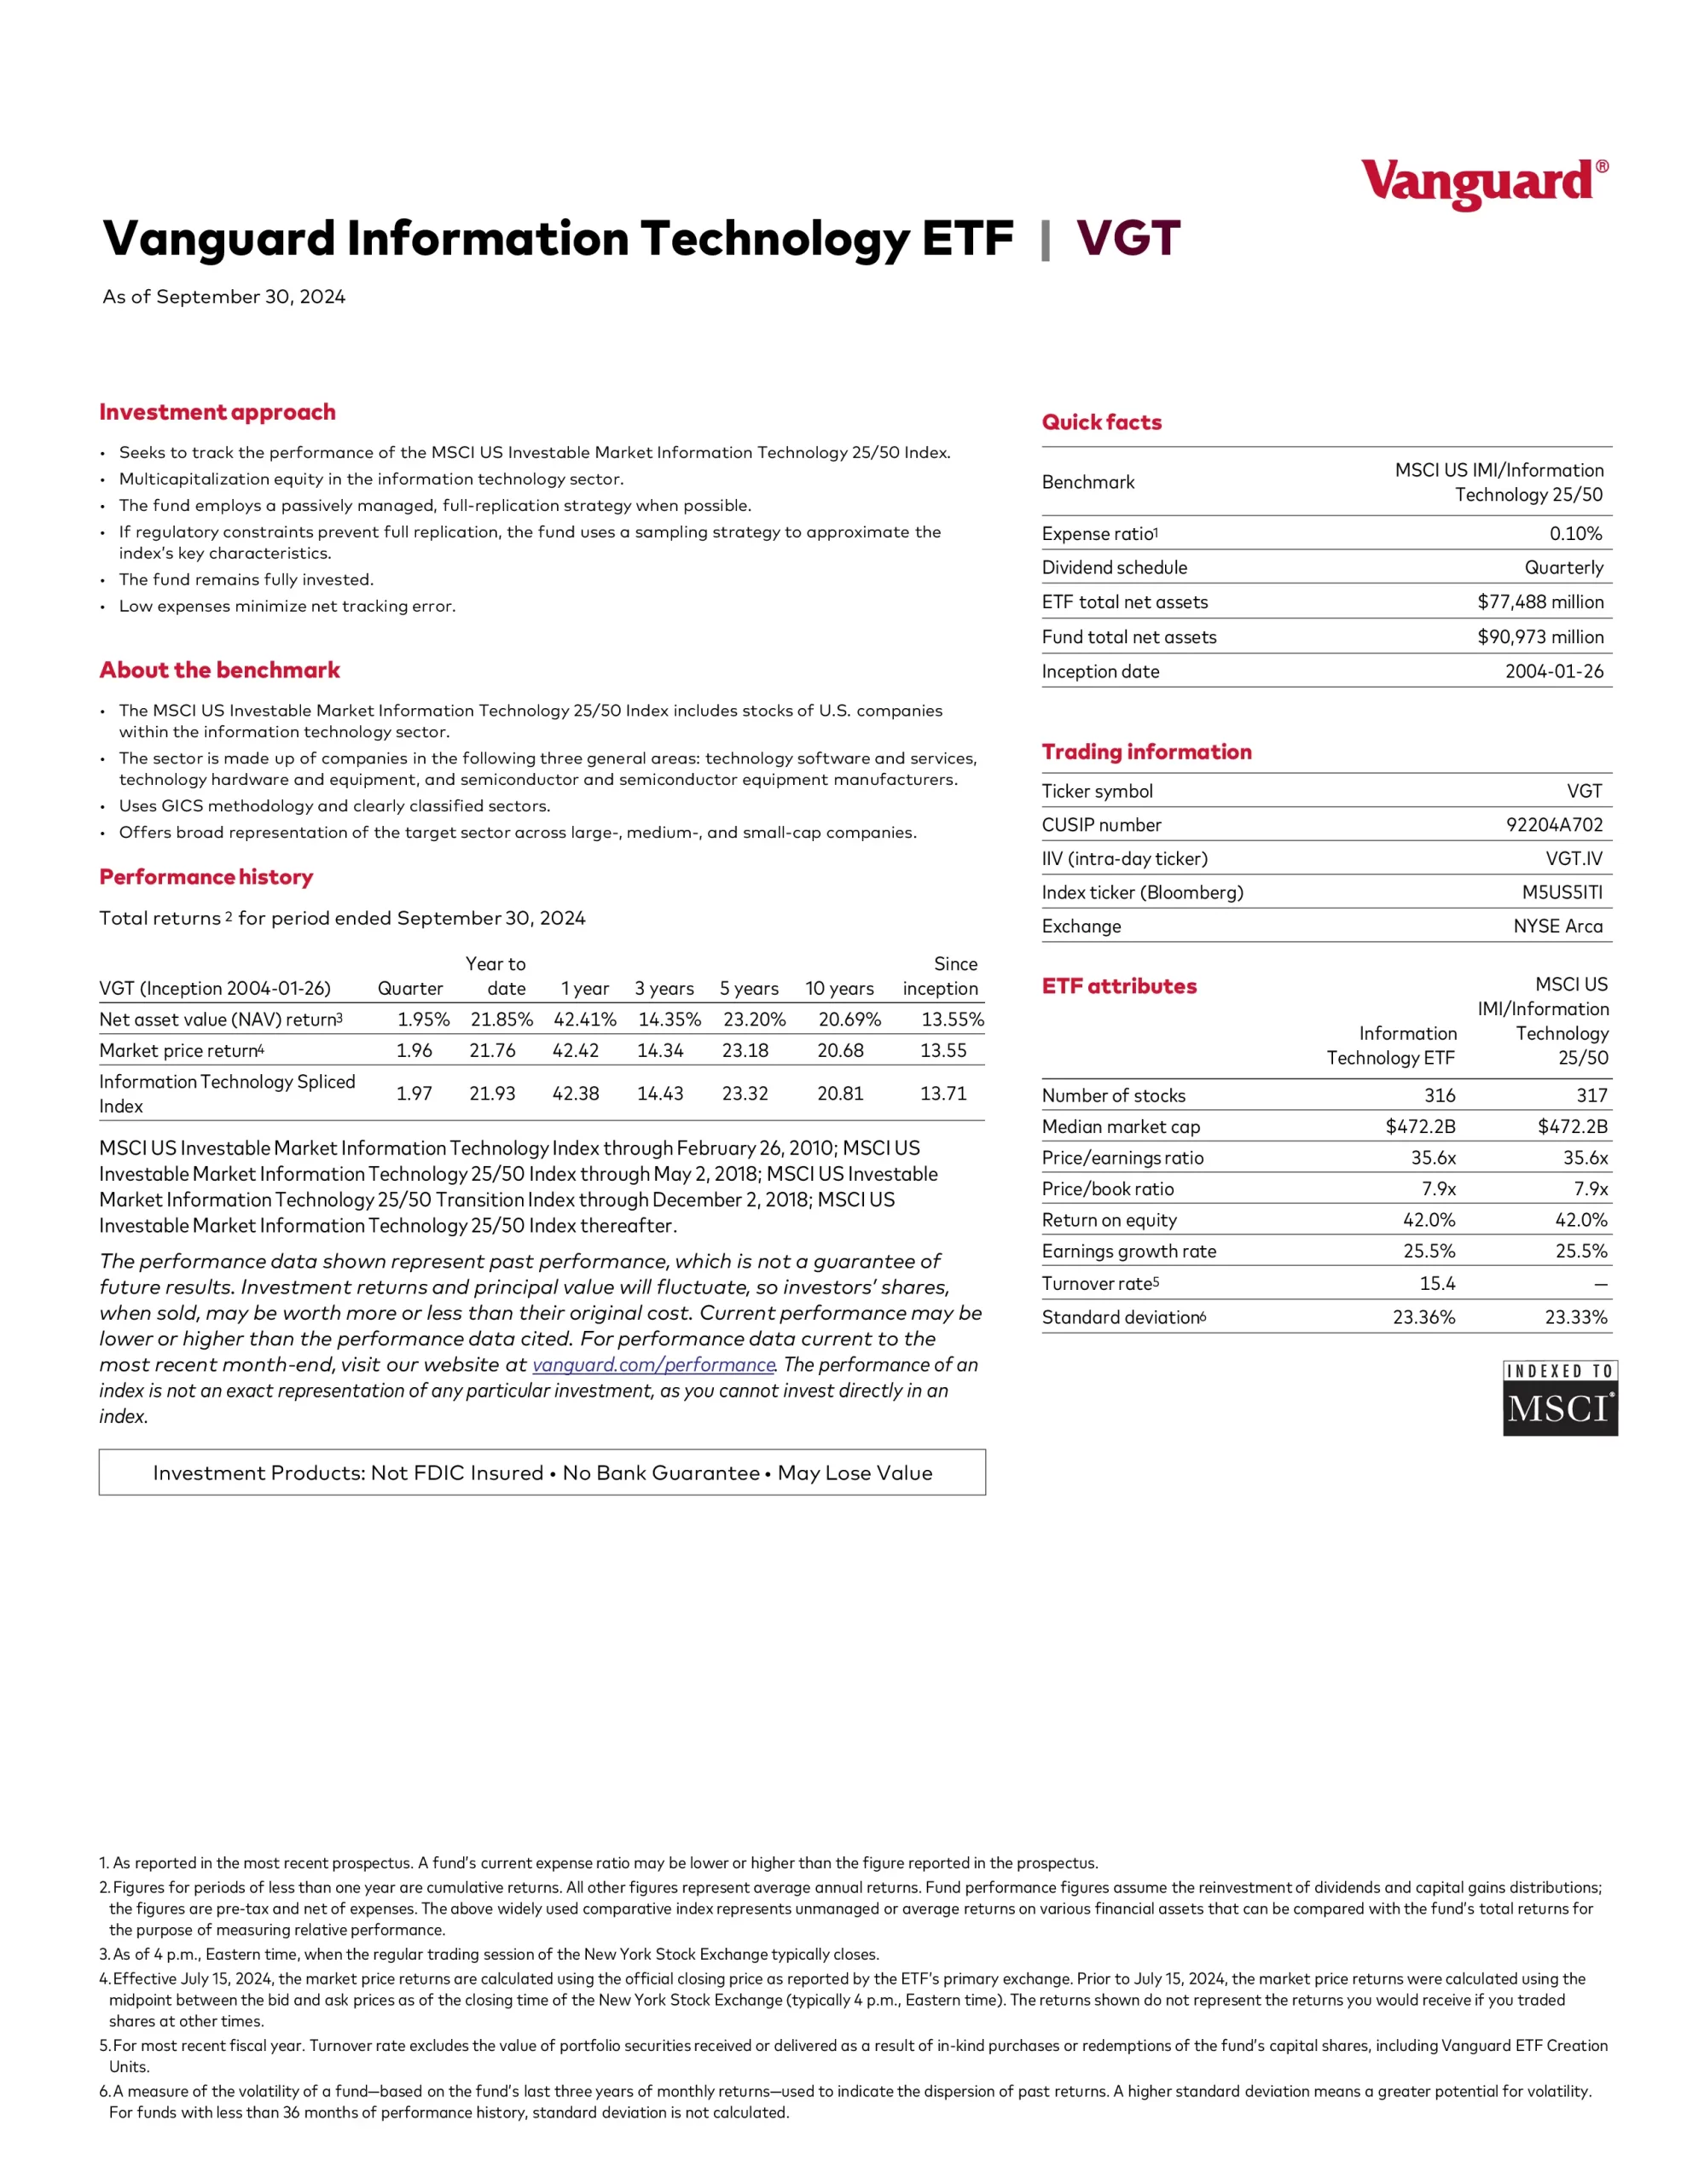
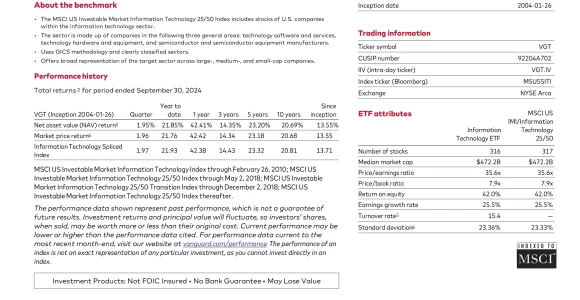
- Seeks to track the performance of the MSCI US Investable Market Information Technology 25/50 Index
- Passively managed using a full-replication strategy when possible and a sampling strategy if regulatory constraints dictate
- Includes stocks of companies that serve the electronics and computer industries or that manufacture products based on the latest applied science

Top 10 VGT Holdings
| Ticker | Name | Weight |
|---|---|---|
| MSFT | Microsoft Corp. | 18.21 % |
| AAPL | Apple Inc. | 16.39 % |
| NVDA | NVIDIA Corp. | 10.42 % |
| AVGO | Broadcom Inc. | 4.20 % |
| AMD | Advanced Micro Devices Inc. | 2.27 % |
| CRM | salesforce.com Inc. | 2.19 % |
| ADBE | Adobe Inc. | 1.85 % |
| ACN | Accenture plc Class A | 1.72 % |
| CSCO | Cisco Systems Inc. | 1.44 % |
| INTU | Intuit Inc. | 1.36 % |
VGT Performance
Quickly compare and contrast VGT to other investments focused on US sector equities by fees, performance, yield, and other metrics to decide which ETF fits in your portfolio.
| ETF | Inception | MER | AUM | Holdings | Beta | P/E | Yield | Distributions | 1Y | 3Y | 5Y | 10Y | 15Y |
|---|---|---|---|---|---|---|---|---|---|---|---|---|---|
| ARKW | 2014-09-30 | 0.88% | $1,769,000,000 | 35-55 | 1.96 | N/A | N/A | N/A | 39.73% | -23.35% | 7.91% | N/A | N/A |
| AVRE | 2021-09-29 | 0.17% | $389,353,894 | 286 | N/A | 19.93 | 3.50% | Quarterly | -4.14% | N/A | N/A | N/A | N/A |
| IXJ | 2001-11-13 | 0.42% | $4,062,978,204 | 113 | 0.70 | 25.32 | 1.32% | Semi-Annually | 14.42% | 8.13% | 9.91% | 8.73% | 13.08% |
| SCHG | 2009-12-11 | 0.04% | $26,423,442,669 | 250 | 1.18 | 40.70 | 0.43% | Quarterly | 42.94% | 13.22% | 19.19% | 15.95% | N/A |
| FTEC | 2013-10-21 | 0.084% | $9,430,000,000 | 303 | 1.23 | 38.91 | 0.71% | Quarterly | 37.90% | 14.70% | 22.45% | 20.16% | N/A |
| AIRR | 2014-03-10 | 0.70% | $621,267,599 | 47 | 1.20 | 21.02 | 0.24% | Quarterly | 14.78% | 17.59% | 18.74% | N/A | N/A |
| XDAT | 2021-01-12 | 0.50% | $6,060,000 | 44 | 1.08 | 58.72 | N/A | N/A | 39.75% | -3.21% | N/A | N/A | N/A |
| PAVE | 2017-03-06 | 0.47% | $6,210,000,000 | 100 | 1.30 | 19.75 | 0.69% | Semi-Annually | 19.43% | 18.99% | 18.74% | N/A | N/A |
| QQQ | 1999-03-10 | 0.20% | $254,330,000,000 | 101 | 1.18 | 35.50 | 0.59% | Quarterly | 39.32% | 12.40% | 20.65% | 18.60% | 20.64% |
| BBRE | 2018-06-15 | 0.11% | $796,300,000 | 119 | 1.15 | 27.81 | 3.84% | Quarterly | -1.30% | 5.44% | 4.10% | N/A | N/A |
| ACES | 2018-06-27 | 0.55% | $269,064,473 | 41 | 1.48 | 12.05 | 1.73% | Quarterly | -42.42% | -30.37% | 4.56% | N/A | N/A |
| TRFK | 2022-06-08 | 0.60% | $21,077,212 | 78 | N/A | 40.09 | 0.19% | Quarterly | 61.93% | N/A | N/A | N/A | N/A |
| TDV | 2019-11-05 | 0.45% | $205,590,000 | 37 | 1.13 | N/A | 1.14% | Quarterly | 19.12% | 9.70% | N/A | N/A | N/A |
| XLK | 1998-12-16 | 0.09% | $64,176,830,000 | 65 | 1.22 | 38.67 | 0.71% | Quarterly | 39.12% | 17.24% | 24.24% | 20.69% | 20.56% |
| SMH | 2011-12-20 | 0.35% | $17,320,000,000 | 26 | 1.62 | 17.52 | 0.56% | Annually | 71.95% | 23.69% | 34.65% | 27.22% | N/A |
| VGT | 2004-03-25 | 0.10% | $64,700,000,000 | 315 | 1.24 | 37.99 | 0.69% | Quarterly | 37.09% | 14.45% | 22.29% | 20.39% | 20.92% |
| VOO | 2016-06-24 | 0.03% | $416,600,000,000 | 505 | 1.00 | 25.68 | 1.33% | Quarterly | 29.85% | 11.45% | 15.01% | 12.92% | 15.59% |
| VTI | 1997-07-07 | 0.03% | $376,400,000,000 | 3731 | 1.01 | 23.95 | 1.36% | Quarterly | 29.38% | 9.65% | 14.25% | 12.28% | 15.45% |
| VUG | 1998-05-14 | 0.04% | $116,300,000,000 | 208 | 1.20 | 40.65 | 0.53% | Quarterly | 38.84% | 10.93% | 17.92 | 15.07% | 17.19% |
| WTAI | 2021-12-07 | 0.45% | $234,826,920 | 79 | N/A | 32.86 | 0.14% | Annually | 21.59% | N/A | N/A | N/A | N/A |
| VRAI | 2019-02-07 | 0.55% | $6,910,623 | 90 | N/A | 11.29 | 5.22% | Quarterly | -3.83% | -4.90% | 4.62% | N/A | N/A |
VGT vs QQQ
VGT is the superior performing, less expensive and higher yielding ETF than QQQ which is older, more popular, more diversified and less volatile. Both investments have quarterly distributions.
VGT vs XLK
VGT is the superior performing, more diversified and more popular ETF than XLK which is older, less expensive, less volatile and higher yielding. Both investments have quarterly distributions.
VGT vs VOO
VGT is the superior performing and older ETF than VOO which is less expensive, more diversified, less volatile and higher yielding. Both investments have quarterly distributions.
VGT vs VTI
VGT is the superior performing ETF than VTI which is older, more popular, more diversified, less volatile and higher yielding. Both investments have quarterly distributions.
VGT vs VUG
VGT is the superior performing and higher yielding ETF than VUG which is older, more popular, more diversified and less volatile. Both investments have quarterly distributions.
VGT vs FTEC
VGT is the superior performing and older ETF than FTEC which is less expensive, more diversified, less volatile and higher yielding. Both investments have quarterly distributions.
VGT vs SMH
SMH is the superior performing ETF than VGT which is older, more popular, more diversified, less volatile and higher yielding. Both investments have quarterly distributions.
VGT vs SCHG
VGT is the superior performing, more popular and older ETF than SCHG which is more diversified, less volatile and higher yielding. Both investments have quarterly distributions.
Conclusion
Vanguard Information Technology Index Fund ETF Shares (VGT) is a long-term income investment to gain exposure to US sector equities. VGT is a convenient way to invest in technology stocks that has outperformed many index ETFs over a long time horizon.