VWO ETF Review
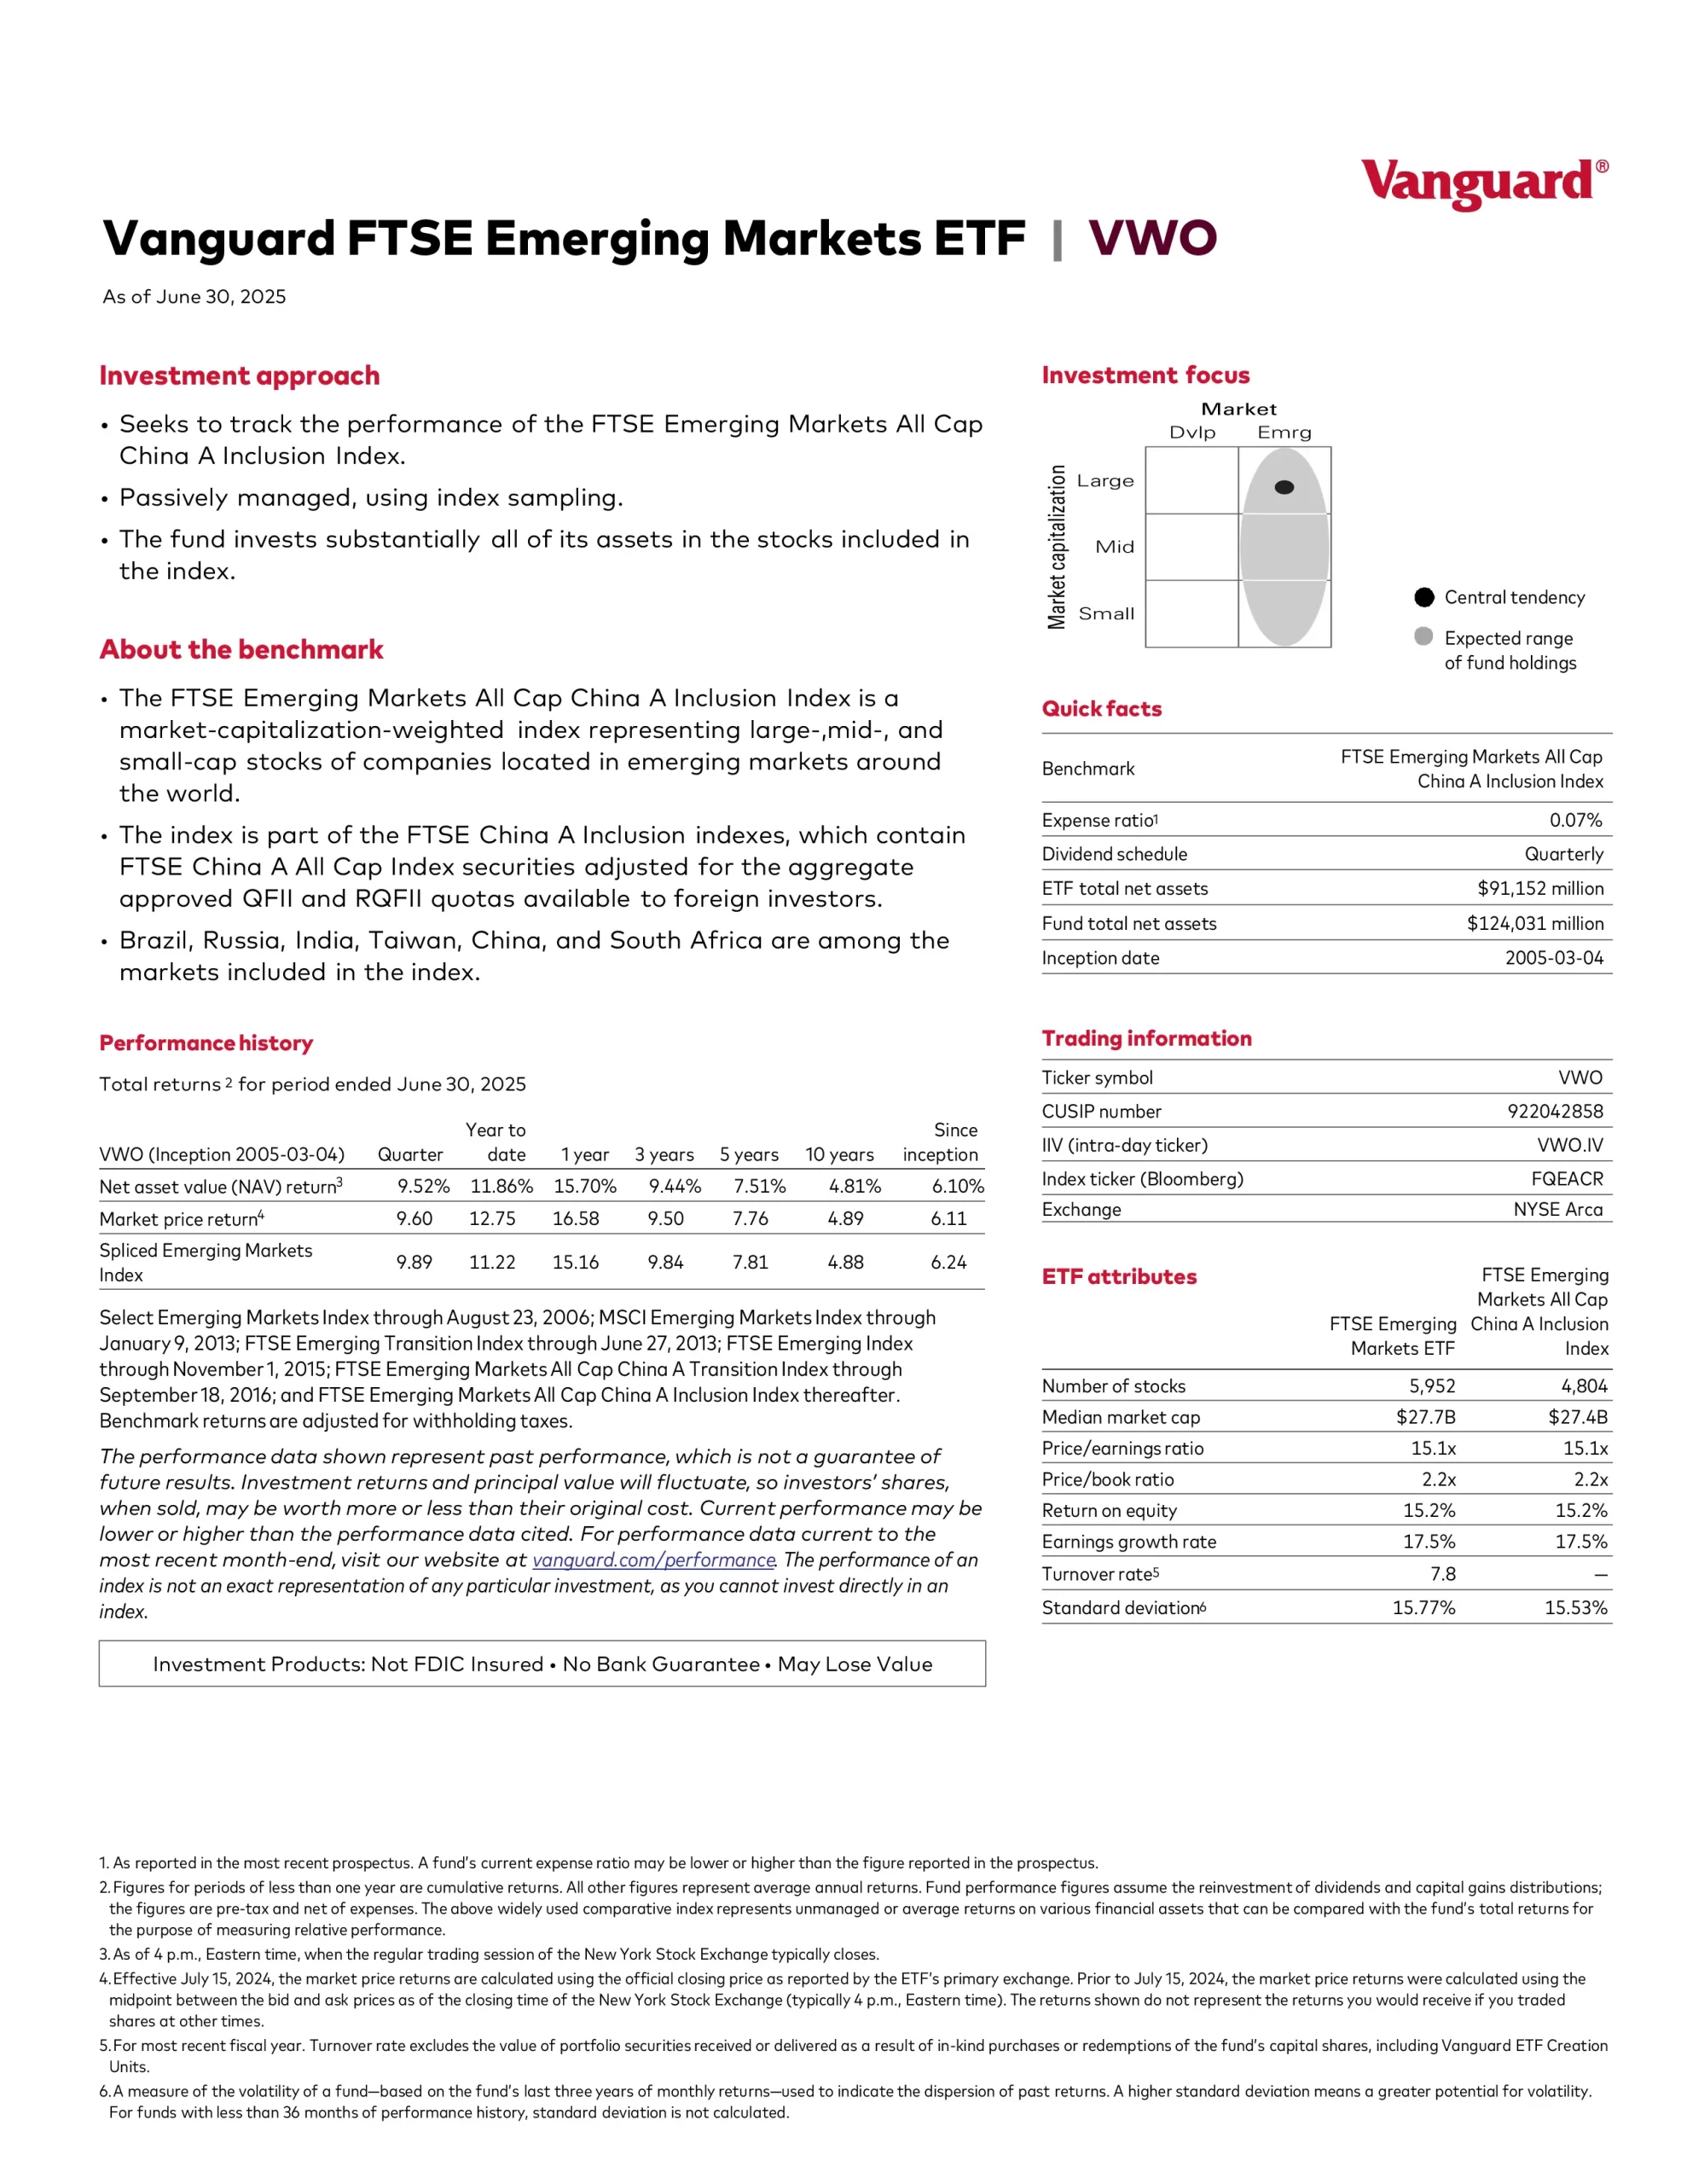
Vanguard FTSE Emerging Markets ETF (VWO) seeks to track the performance of a benchmark index that measures the investment return of stocks issued by companies in emerging market countries. The fund invests in stocks of companies in emerging markets worldwide, such as China, Brazil, Taiwan, and South Africa.
- Goal is to closely track the return of the FTSE Emerging Markets All Cap China A Inclusion Index.
- Has high potential for growth, but also high risk; share value may swing up and down more than that of stock funds that invest in developed countries, including the United States.
- Only appropriate for long-term goals.

Is VWO a Good ETF?
Quickly compare similar ETFs by fees, performance, yield, and other metrics to decide which ETF fits in your portfolio.
| ETF | Inception | AUM | MER | Distributions | Holdings | 1Y | 3Y | 5Y | 10Y | 15Y |
|---|---|---|---|---|---|---|---|---|---|---|
| AVEM | 2019-09-17 | $6,934,014,660 | 0.33% | Semi-Annually | 3462 | 25.71% | 1.64% | 6.47% | N/A | N/A |
| EEM | 2003-04-07 | $17,660,020,711 | 0.70% | Semi-Annually | 1,210 | 23.50% | -2.22% | 3.07% | 2.70% | 3.09% |
| ESGE | 2016-06-28 | $4,403,882,651 | 0.25% | Semi-Annually | 309 | 22.52% | -3.16% | 3.12% | N/A | N/A |
| IEMG | 2012-10-18 | $80,554,465,218 | 0.09% | Semi-Annually | 2,858 | 23.84% | -1.06% | 4.40% | 3.60% | N/A |
| FNDE | 2013-08-15 | $6,322,991,467 | 0.39% | Semi-Annually | 420 | 29.70% | 3.90% | 5.97% | 5.16% | N/A |
| SCHE | 2010-01-14 | $9,202,323,950 | 0.11% | Semi-Annually | 2,018 | 25.90% | -0.03% | 4.51% | 3.68% | N/A |
| DFEM | 2022-04-27 | $4,200,000,000 | 0.39% | Quarterly | 6,102 | 24.19% | N/A | N/A | N/A | N/A |
| DFEV | 2022-04-27 | $756,400,000 | 0.43% | Quarterly | 2,835 | 25.09% | N/A | N/A | N/A | N/A |
| FRDM | 2019-05-22 | $891,350,000 | 0.49% | Quarterly | 118 | 27.85% | 5.00% | 8.13% | N/A | N/A |
| GEM | 2015-09-25 | $937,210,000 | 0.52% | Quarterly | 809 | 22.57% | -1.02% | 3.11% | N/A | N/A |
| PXH | 2007-09-27 | $1,206,100,000 | 0.49% | Quarterly | 412 | 28.96% | 3.62% | 4.88% | 4.21% | 3.49% |
| JEMA | 2021-03-10 | $1,040,000,000 | 0.33% | Annually | 514 | 20.68% | -4.21% | N/A | N/A | N/A |
| SPEM | 2007-03-20 | $9,986,730,000 | 0.07% | Semi-Annually | 3,131 | 27.19% | 0.79% | 5.39% | 4.22% | 4.51% |
| VWO | 2005-03-04 | $82,600,000,000 | 0.08% | Quarterly | 5896 | 25.46% | 0.22% | 4.98% | 3.65% | 4.13% |
| DEM | 2007-07-13 | $2,784,293,410 | 0.63% | Quarterly | 484 | 21.83% | 6.11% | 5.82% | 3.99% | 4.26% |
| DGS | 2007-10-30 | $1,974,461,870 | 0.58% | Quarterly | 1084 | 21.29% | 4.24% | 7.09% | 5.20% | 5.61% |