You can find more details about this exchange traded fund (ETF) in its prospectus. Before you invest, consider how the ETF would work with your other investments and your risk tolerance. The value of the ETF can go down as well as up. You could lose money. ETFs do not have any guarantees. You may not get back the amount of money you invest. You may have to pay a commission every time you buy and sell units of the ETF. Commissions may vary by brokerage firm.
XIC ETF Review
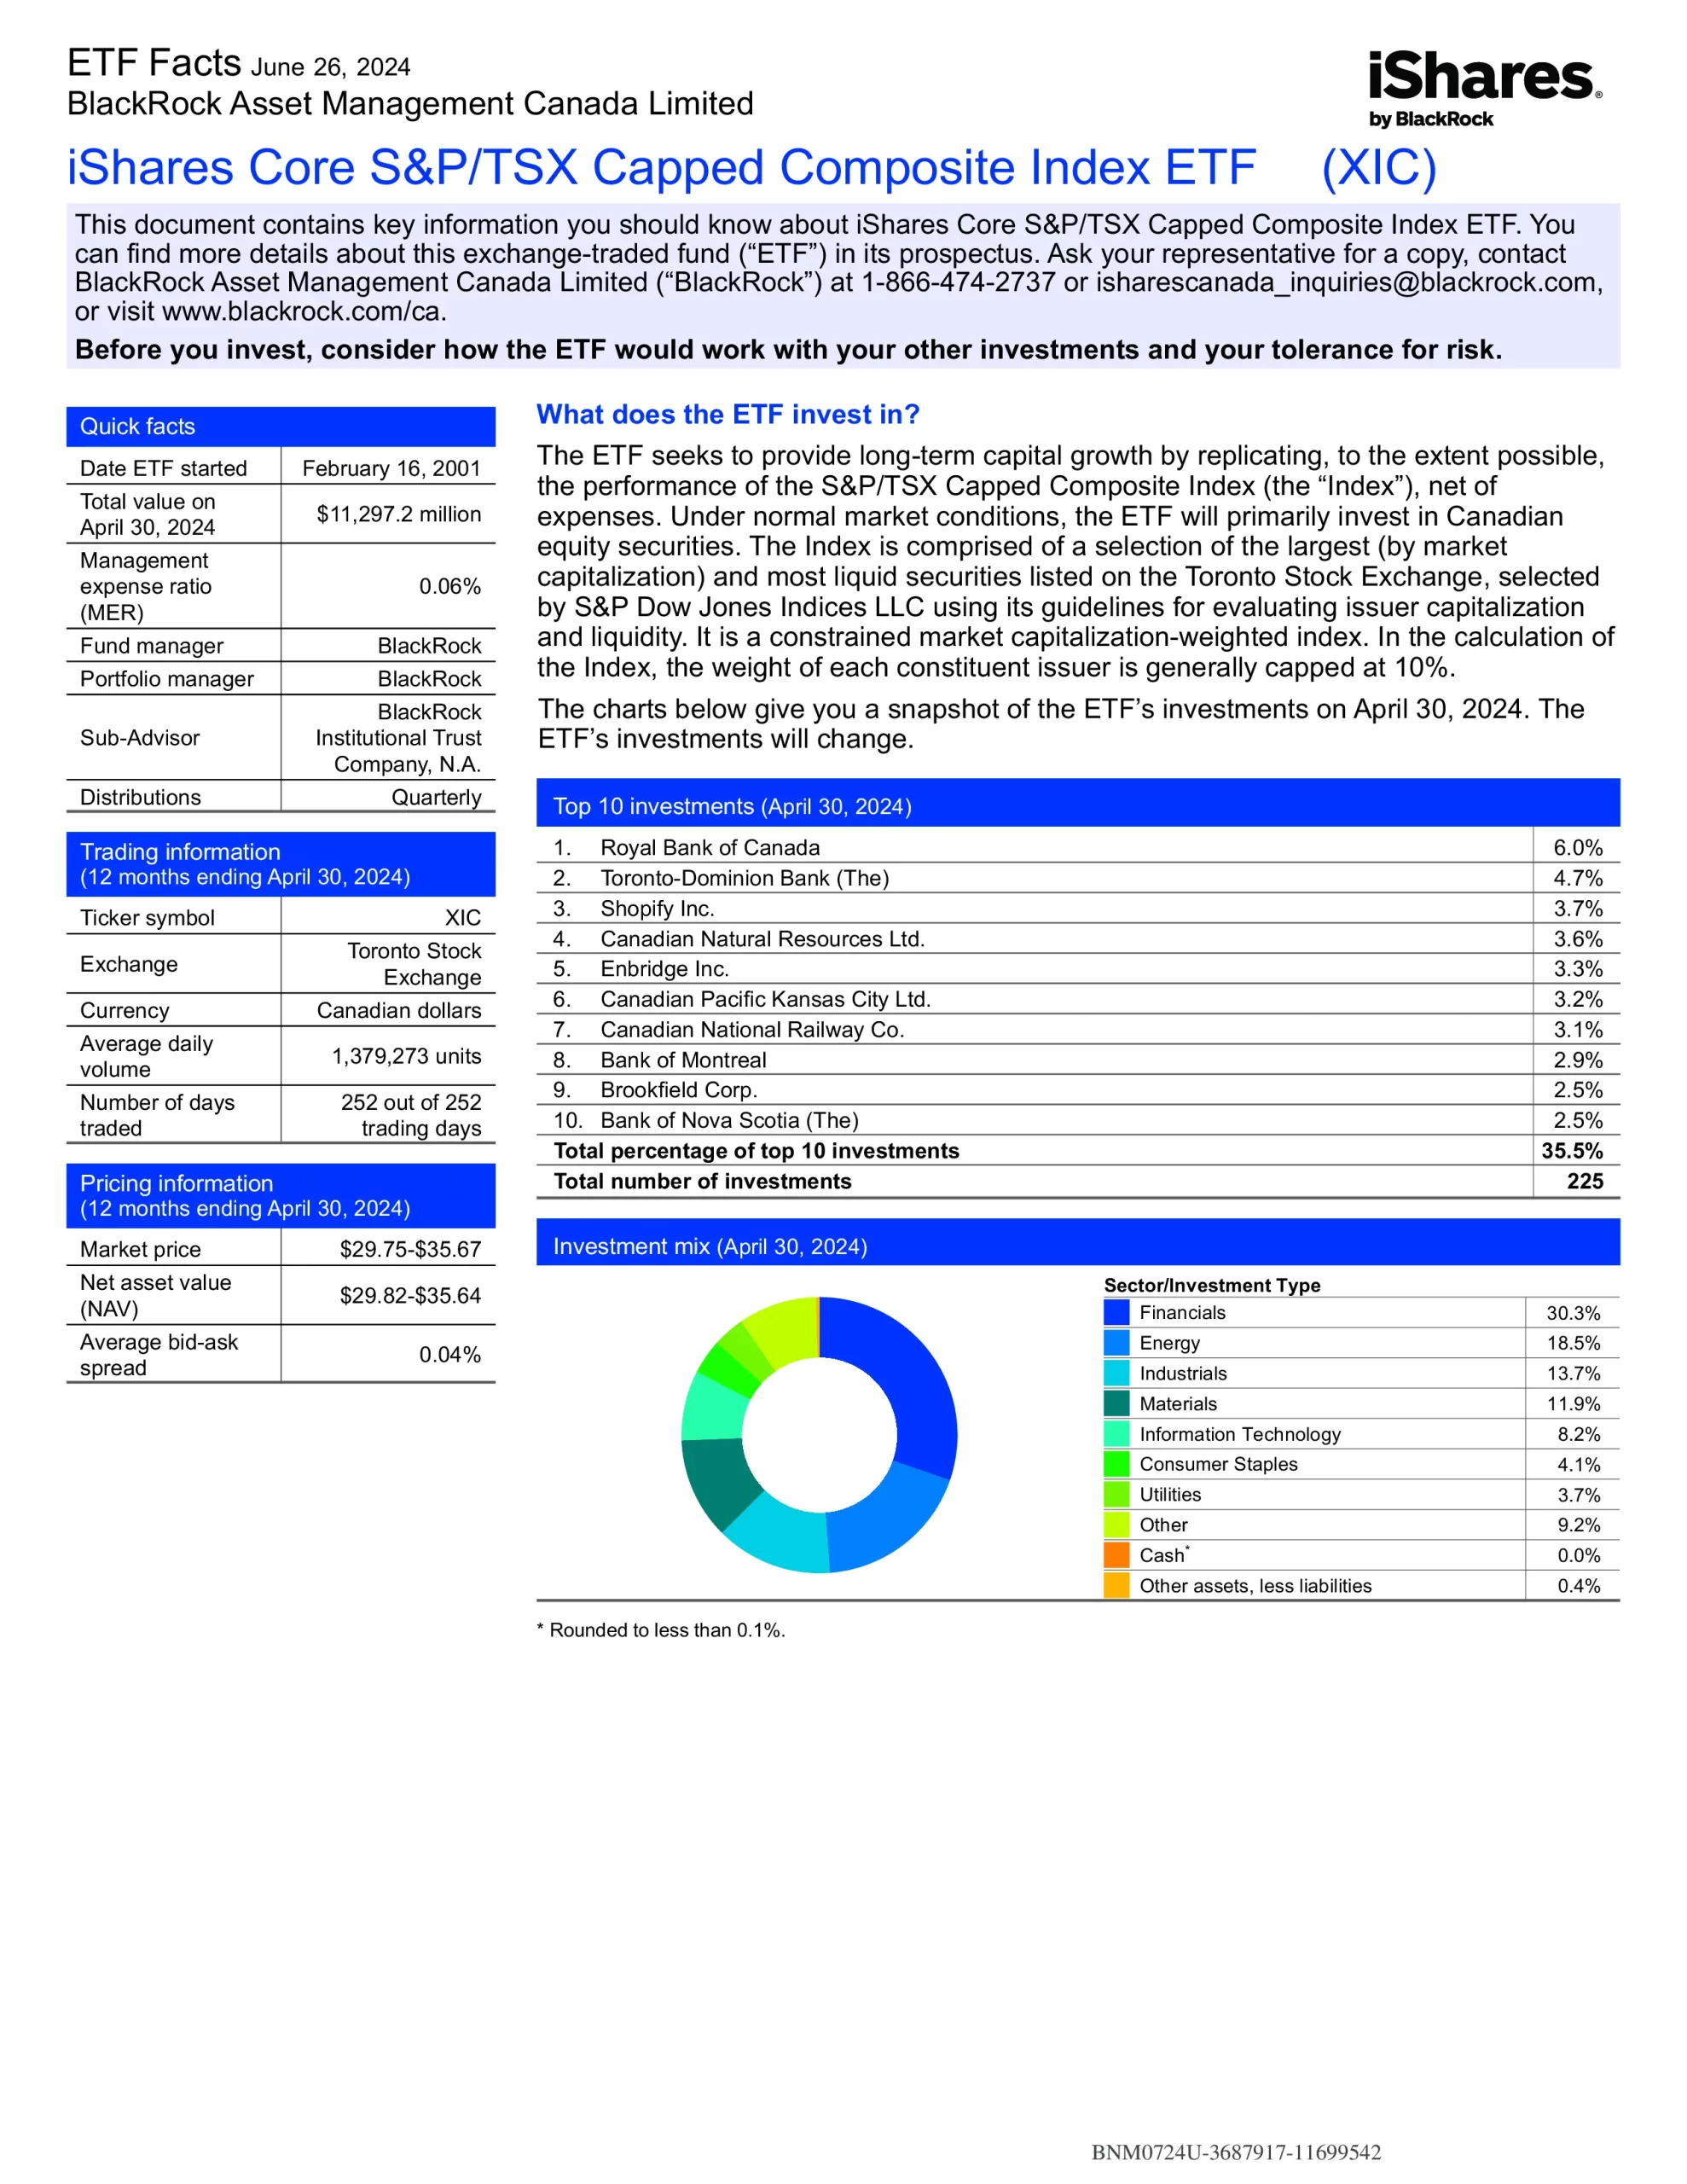
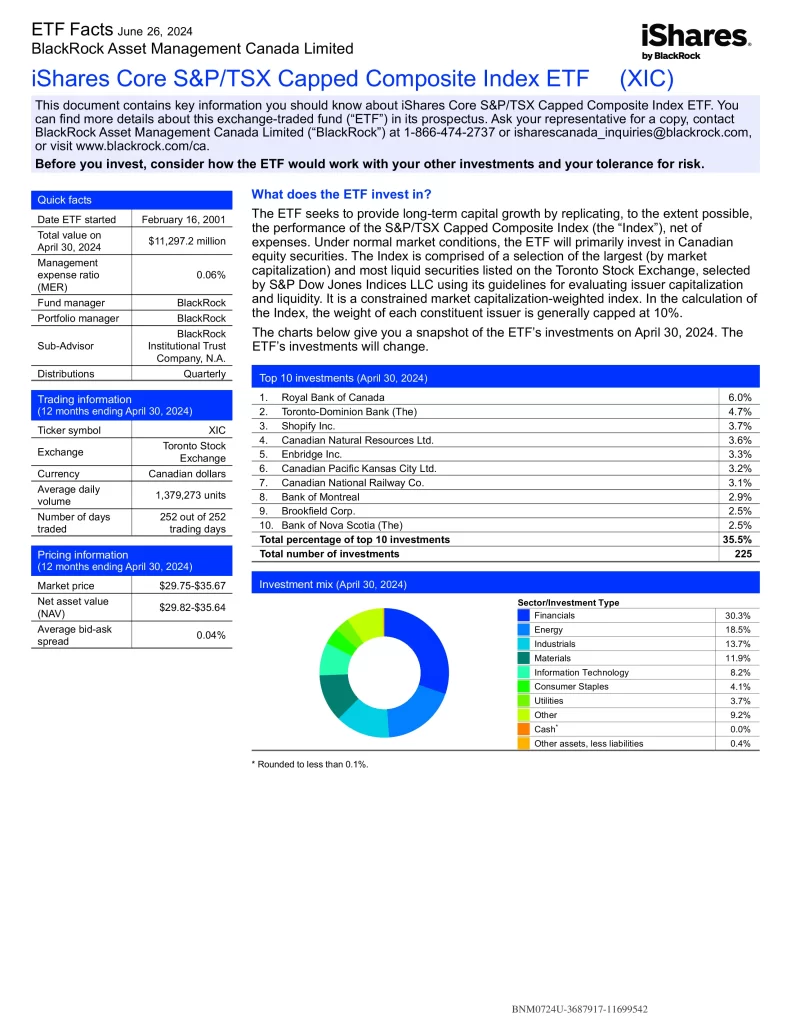
iShares Core S&P/TSX Capped Composite Index ETF (XIC) seeks to provide long-term capital growth by replicating, to the extent possible, the performance of the S&P/TSX Capped Composite Index. Under normal market conditions, the ETF will primarily invest in Canadian equity securities. The Index is comprised of a selection of the largest (by market capitalization) and most liquid securities listed on the Toronto Stock Exchange, selected by S&P Dow Jones Indices LLC using its guidelines for evaluating issuer capitalization and liquidity. It is a constrained market capitalization-weighted index. In the calculation of the Index, the weight of each constituent issuer is generally capped at 10%. This ETF allows you to own the Canadian stock market as a long-term core holding at a low cost.
- Designed to be a long-term core holding
- Own the entire Canadian stock market
- Low cost
Top 10 XIC Holdings
The top 10 investments of XIC account for 35.5% of the 225 holdings. The ETF’s holdings are subject to change.
| Ticker | Name | Weight |
|---|---|---|
| RY | ROYAL BANK OF CANADA | 6.64% |
| TD | TORONTO DOMINION | 4.19% |
| SHOP | SHOPIFY SUBORDINATE VOTING INC CLA | 3.36% |
| CNQ | CANADIAN NATURAL RESOURCES LTD | 3.28% |
| ENB | ENBRIDGE INC | 3.22% |
| CP | CANADIAN PACIFIC KANSAS CITY LTD | 3.21% |
| CNR | CANADIAN NATIONAL RAILWAY | 2.88% |
| BN | BROOKFIELD CORP CLASS A | 2.67% |
| BMO | BANK OF MONTREAL | 2.64% |
| CSU | CONSTELLATION SOFTWARE INC | 2.52% |
Is XIC a Good Investment?
Quickly compare XIC to similar investments focused on Canadian equity ETFs by risk, fees, performance, yield, volatility, and other metrics to decide which ETF fits in your portfolio.
| Manager | ETF | Risk | Inception | MER | AUM | Holdings | Beta | P/E | Yield | Distributions | 1Y | 3Y | 5Y | 10Y | 15Y |
|---|---|---|---|---|---|---|---|---|---|---|---|---|---|---|---|
| BlackRock | XIC | Medium | 2001-02-16 | 0.06% | $12,748,173,743 | 227 | 1.00 | 13.40 | 2.82% | Quarterly | 12.06% | 5.92% | 9.26% | 6.93% | 8.18% |
| BMO | ZCN | Medium | 2009-05-29 | 0.06% | $8,224,580,000 | 228 | 1.00 | N/A | 3.15% | Quarterly | 12.04% | 5.92% | 9.26% | 6.93% | 7.71% |
| Vanguard | VCN | Medium | 2013-08-02 | 0.05% | $6,730,000,000 | 173 | 0.99 | 13.46 | 2.97% | Quarterly | 12.37% | 6.20% | 9.31% | 6.73% | N/A |
Conclusion
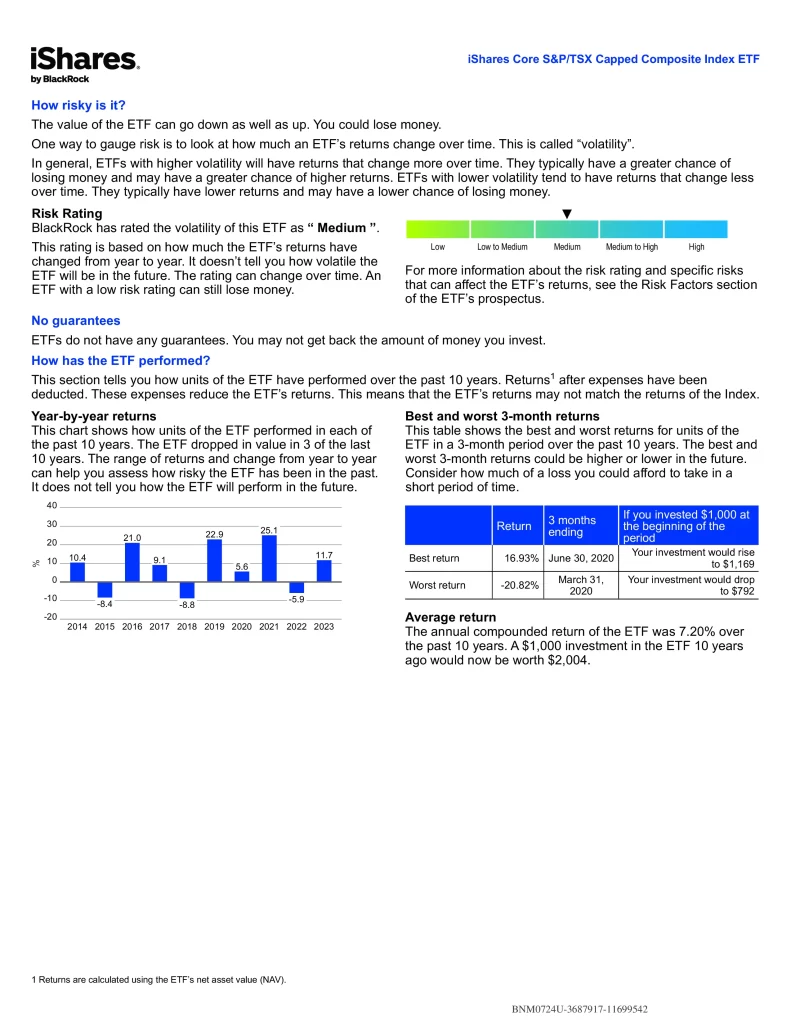
One way to gauge risk is to look at how much an ETF’s returns change over time. This is called volatility. In general, ETFs with higher volatility will have returns that change more over time. They typically have a greater chance of losing money and may have a greater chance of higher returns. ETFs with lower volatility tend to have returns that change less over time. They typically have lower returns and may have a lower chance of losing money. An ETF with a low-risk rating can still lose money. The bid is the highest price a buyer is willing to pay if you want to sell your ETF units. The ask is the lowest price a seller is willing to accept if you want to buy ETF units. The difference between the two is called the bid-ask spread. In general, a smaller bid-ask spread means the ETF is more liquid. That means you are more likely to get the price you expect. In general, market prices of ETFs can be more volatile around the start and end of the trading day.

