ZMMK ETF Review
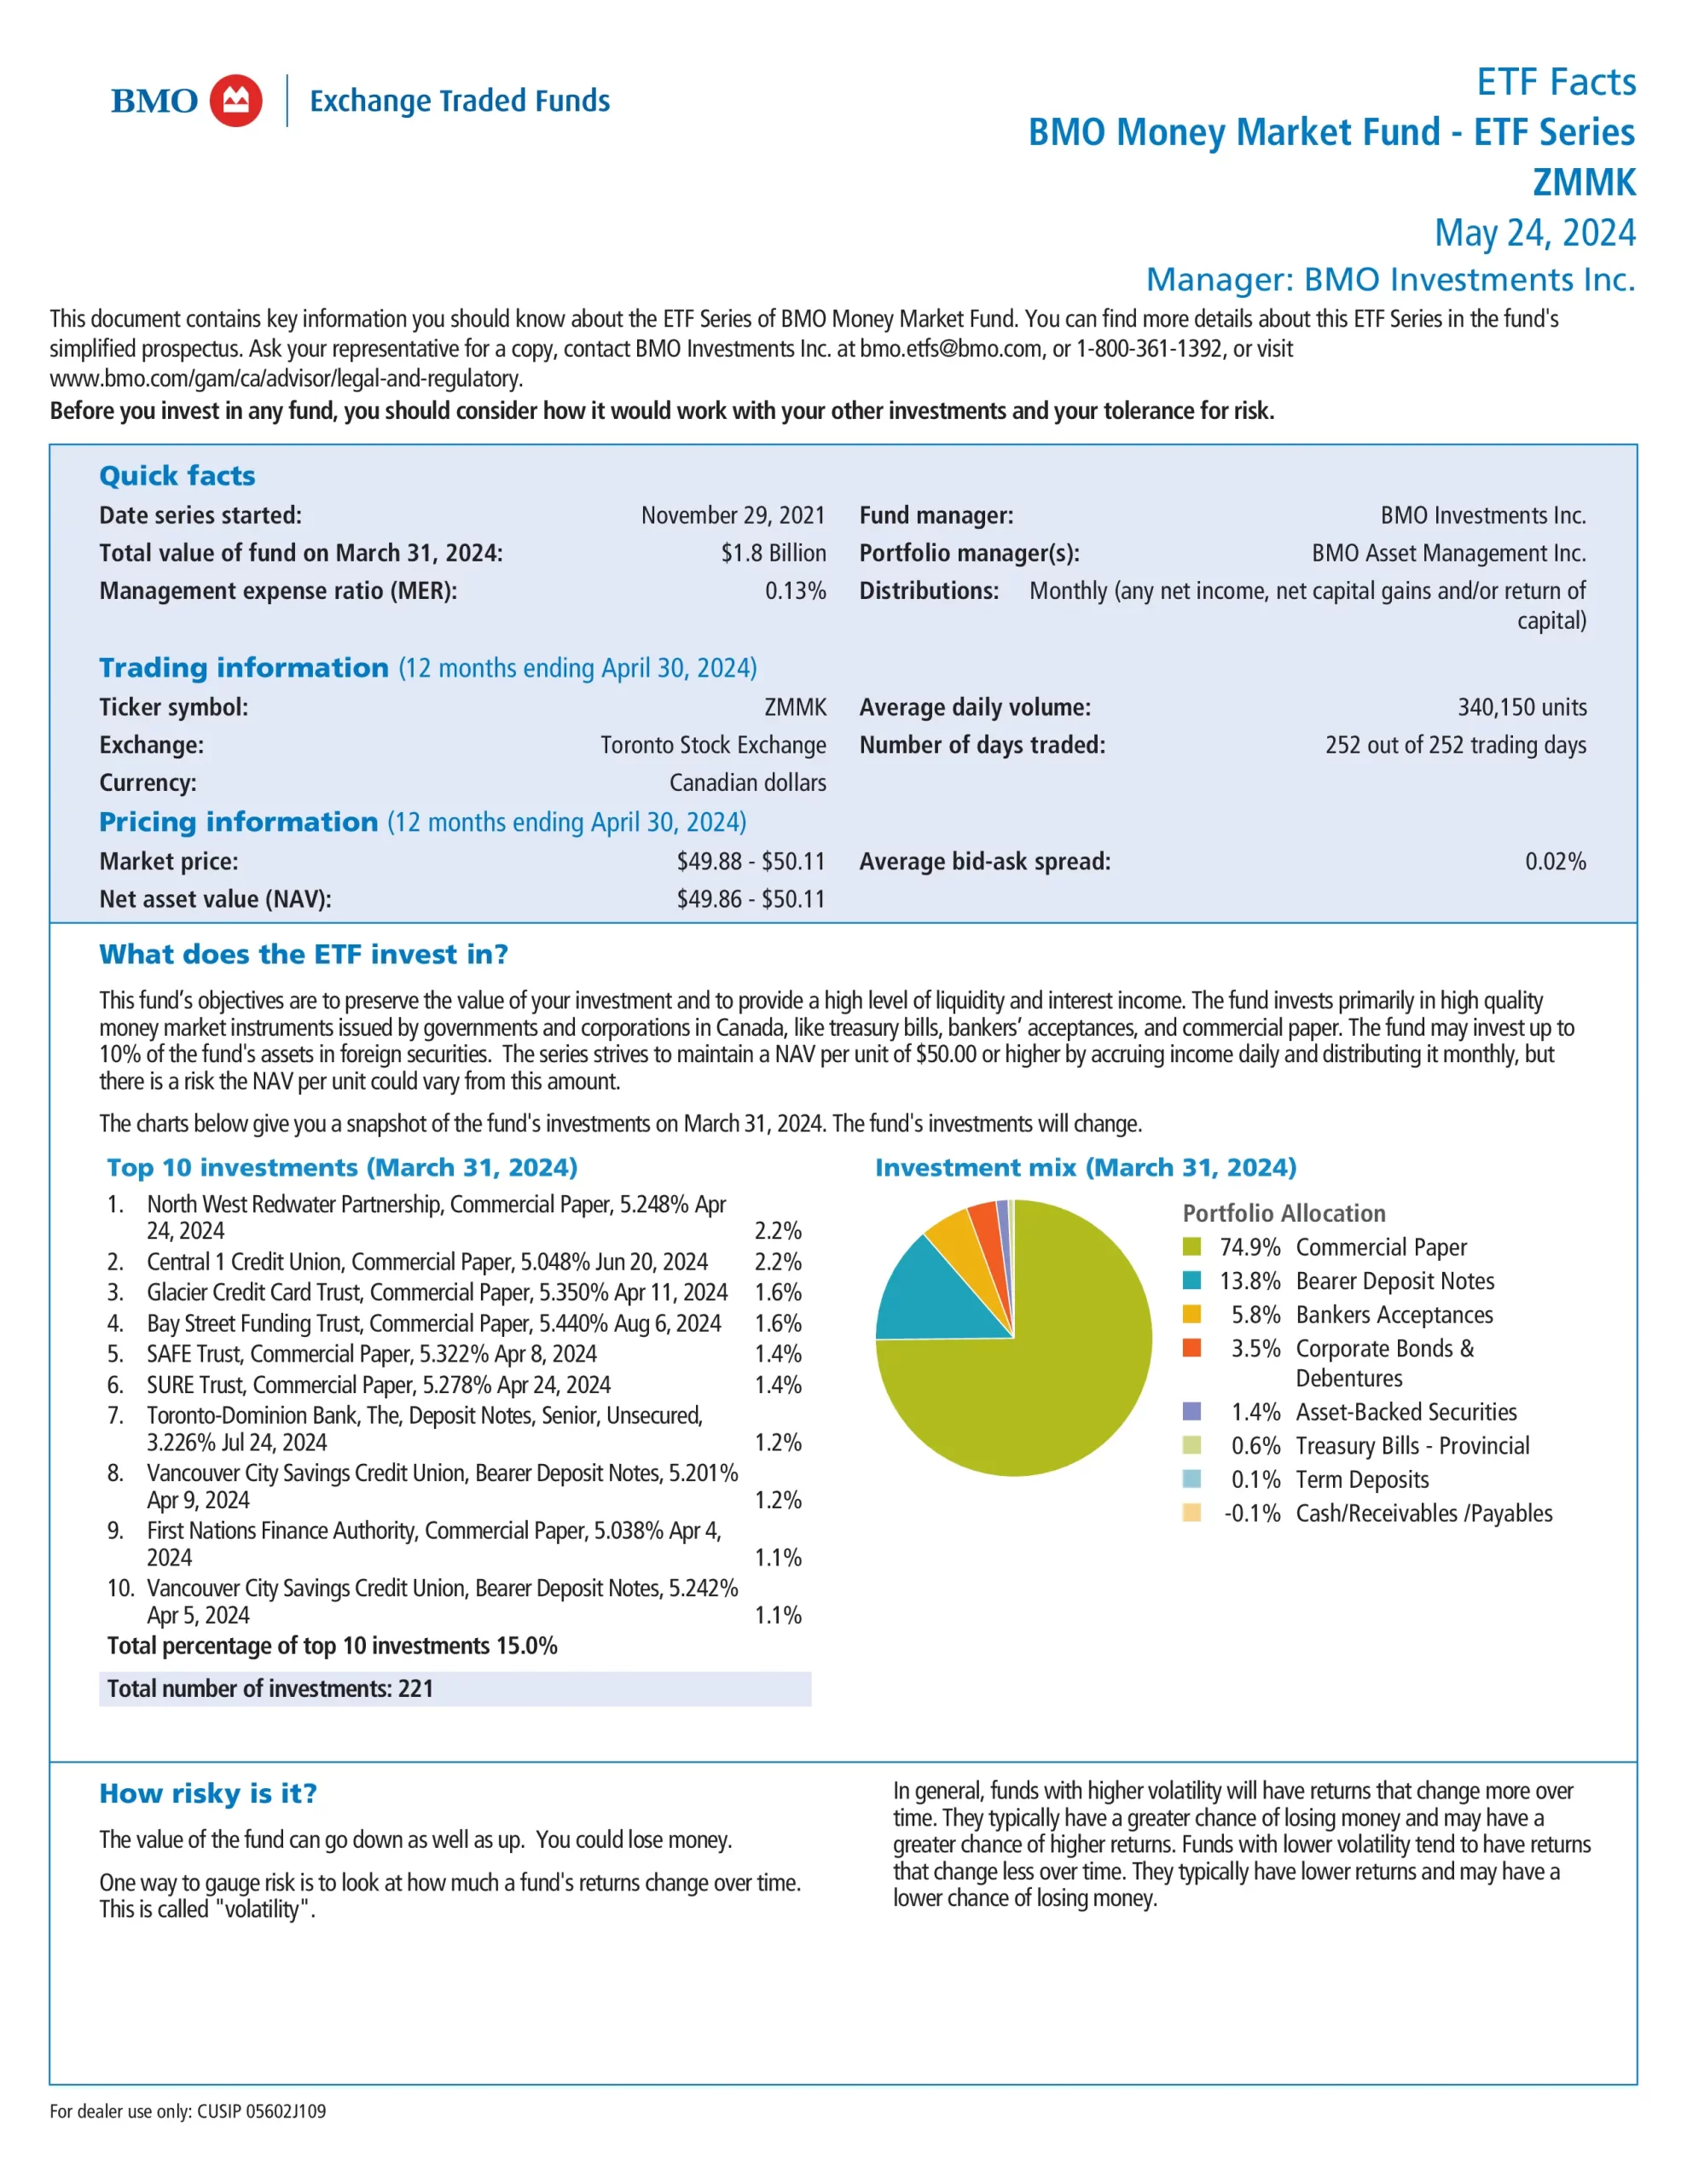
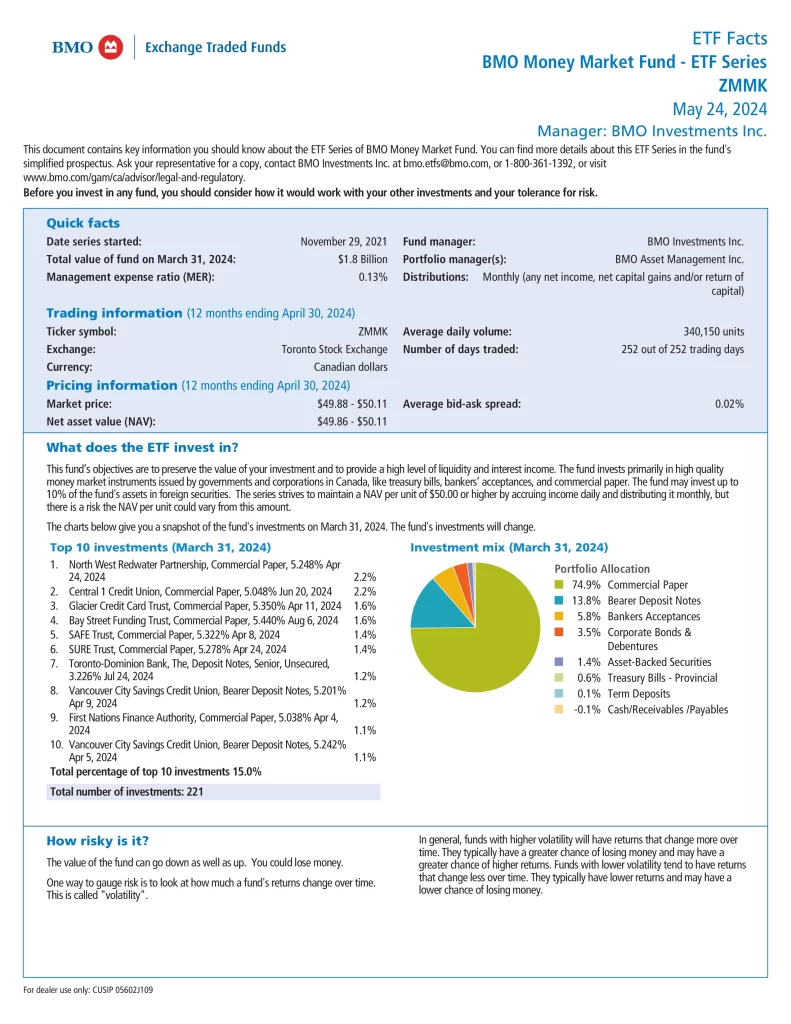
BMO Money Market Fund ETF Series (ZMMK) provides exposure to high-quality money market instruments issued by governments and corporations in Canada, including treasury bills, bankers’ acceptances, and commercial paper. The manager selects high-quality money market securities that mature in less than 365 days and have an average term-to-maturity of less than 90 days. The fund may invest up to 10% of the fund’s assets in foreign securities. The series strives to maintain a NAV per unit of $50.00 or higher by accruing income daily and distributing it monthly, but there is a risk the NAV per unit could vary from this amount.
- Designed for investors looking for a high level of liquidity and capital preservation
- Invested in a diversified portfolio of high-quality money market instruments issued by governments and corporations in Canada
Top 10 ZMMK Holdings
The top 10 investments of ZMMK account for 15.0% of the 221 holdings.
| Name | Weight |
|---|---|
| SUMITOMO MITSUI BANKING | 1.96% |
| BCI QUADREAL REALTY | 1.88% |
| BCI QUADREAL REALTY | 1.87% |
| TORONTO-DOMINION BANK/THE | 1.72% |
| STABLE TRUST | 1.61% |
| MERCEDES B MERCEDES BENZ FIN | 1.48% |
| MUFG BANK LTD CANADA BRANCH | 1.31% |
| MERCEDES B MERCEDES BENZ FIN | 1.29% |
| CENTRAL1 CREDITUNION | 1.25% |
| CARDS II TRUST | 1.17% |
Is ZMMK a Good Investment?
Quickly compare ZMMK to similar investments focused on money market ETFs in Canada by risk, fees, performance, yield, volatility, and other metrics to decide which ETF fits in your portfolio.
| Manager | ETF | Risk | Inception | MER | AUM | Beta | Yield | Distributions | 1Y | 3Y | 5Y | 10Y | 15Y |
|---|---|---|---|---|---|---|---|---|---|---|---|---|---|
 | XFR | Low | 2011-12-06 | 0.14% | $778,069,324 | N/A | 5.15% | Monthly | 5.12% | 3.19% | 2.32% | 1.74% | N/A |
 | ZMMK | Low | 2021-11-29 | 0.13% | $2,334,780,000 | N/A | 5.04% | Monthly | 5.20% | N/A | N/A | N/A | N/A |
 | CMNY | Low | 2023-07-21 | 0.15% | $19,030,000 | N/A | N/A | Monthly | N/A | N/A | N/A | N/A | N/A |
 | CAFR | Low | 2019-01-22 | 0.34% | $366,674,171 | 0.04 | 4.59% | Monthly | 5.31% | 3.23% | 2.42% | N/A | N/A |
 | DXV | Low | 2018-03-23 | 0.33% | $128,710,000 | 0.09 | 6.34% | Monthly | 5.86% | 3.37% | 3.02% | N/A | N/A |
 | MCAD | Low | 2023-05-26 | 0.06% | $167,771,000 | N/A | 5.12% | Monthly | 5.25% | N/A | N/A | N/A | N/A |
 | FHIS | Low | 2022-09-12 | 0.18% | $120,910,000 | N/A | 3.47% | Monthly | 5.85% | N/A | N/A | N/A | N/A |
 | CBIL | Low | 2023-04-12 | 0.11% | $849,103,558 | N/A | 4.93% | Monthly | 4.95% | N/A | N/A | N/A | N/A |
 | GCTB | Low | 2023-07-11 | N/A | $137,892,198 | N/A | N/A | Monthly | N/A | N/A | N/A | N/A | N/A |
 | TBIL | Low | 2024-01-16 | N/A | $32,590,000 | N/A | N/A | Monthly | N/A | N/A | N/A | N/A | N/A |
 | LYFR | Low | 2022-08-26 | 0.49% | $4,600,000 | N/A | 2.66% | Monthly | 3.14% | N/A | N/A | N/A | N/A |
 | QASH | Low | 2023-11-20 | N/A | $38,086,683 | N/A | N/A | Monthly | N/A | N/A | N/A | N/A | N/A |
 | NSAV | Low | 2020-11-17 | 0.16% | $501,650,000 | N/A | 4.73% | Monthly | 5.36% | 3.44% | N/A | N/A | N/A |
 | MNY | Low | 2022-09-14 | 0.22% | $882,200,000 | N/A | 5.85% | Monthly | 6.03% | N/A | N/A | N/A | N/A |
 | TCSH | Low | 2023-10-27 | N/A | $175,350,000 | N/A | N/A | Monthly | N/A | N/A | N/A | N/A | N/A |

