
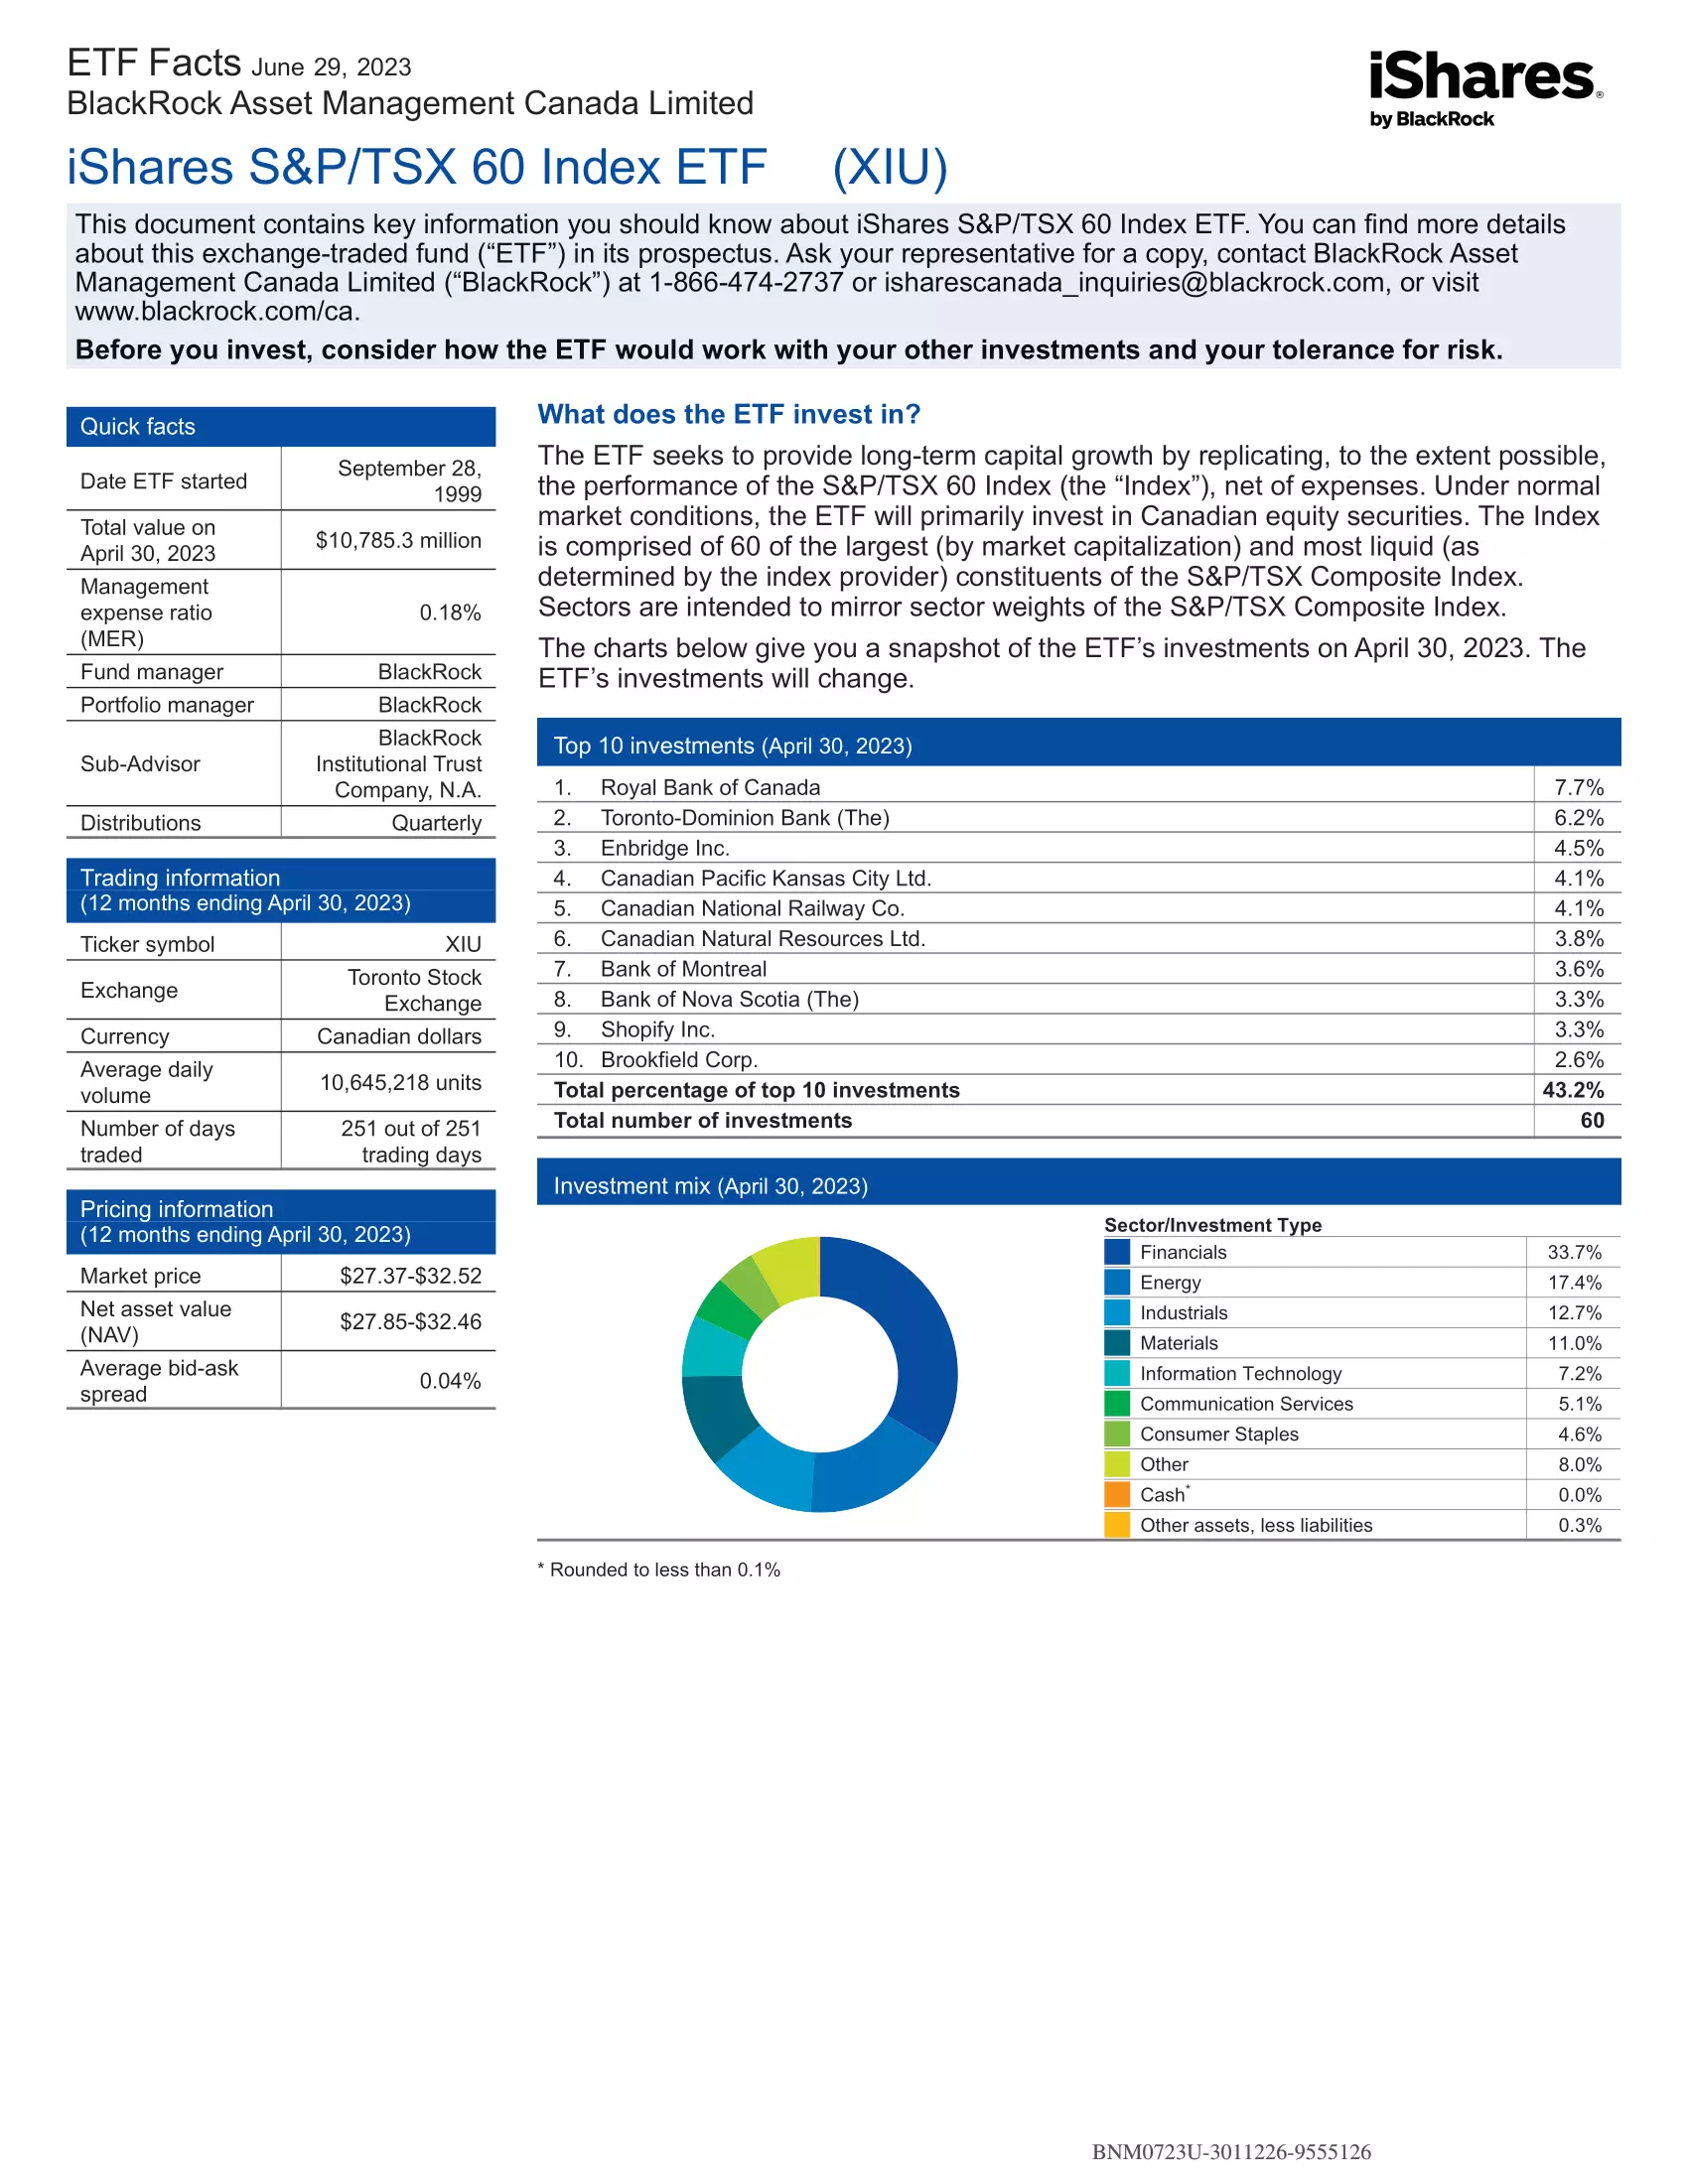
The iShares S&P/TSX 60 Index ETF (XIU.TO) seeks to provide long-term capital growth by replicating, to the extent possible, the performance of the S&P/TSX 60 Index.
XIU ETF Review
Under normal market conditions, the ETF will primarily invest in Canadian equity securities. The Index is comprised of 60 of the largest (by market capitalization) and most liquid (as determined by the index provider) constituents of the S&P/TSX Composite Index. Sectors are intended to mirror sector weights of the S&P/TSX Composite Index.
- Exposure to large, established Canadian companies
- One of the largest and most liquid ETFs in Canada
- Started trading in 1990, making it the first ETF in the world
Top 10 XIU Holdings
| Ticker | Name | Weight |
|---|---|---|
| RY | Royal Bank of Canada | 7.47% |
| TD | Toronto Dominion | 5.97% |
| SHOP | Shopify Inc | 4.96% |
| CP | Canadian Pacific Kansas City Limited | 4.35% |
| CNR | Canadian National Railway Company | 4.15% |
| ENB | Enbridge Inc. | 4.00% |
| CNQ | Canadian Natural Resources Ltd. | 3.82% |
| BMO | Bank of Montreal | 3.69% |
| BN | Brookfield Corporation | 3.19% |
| BNS | Bank of Nova Scotia | 3.10% |
| Manager | ETF | Inception | MER | AUM | P/E | Yield | Distributions | 1Y | 3Y | 5Y | 10Y | 15Y |
|---|---|---|---|---|---|---|---|---|---|---|---|---|
| QCD | 2017-01-30 | 0.45% | $47,800,000 | 12.72 | 3.77% | Annually | 1.9% | 8.9% | 7.9% | N/A | N/A | |
| XIU | 1999-09-28 | 0.18% | $10,898,997,158 | 13.24 | 3.15% | Quarterly | 4.68% | 10.54% | 9.77% | 8.08% | 9.20% | |
| ZLB | 2011-10-21 | 0.39% | $3,414,440,000 | N/A | 2.64% | Quarterly | 5.42% | 11.26% | 9.54% | 10.18% | N/A | |
| FXM | 2012-02-13 | 0.65% | $305,610,000 | 9.47 | 2.96% | Quarterly | 0.86% | 10.89% | 10.67% | 6.42% | N/A | |
| CCEI | 2021-03-31 | 0.05% | $311,119,756 | 12.66 | 3.22% | Quarterly | 6.46% | N/A | N/A | N/A | N/A | |
| ETSX | 2023-01-09 | N/A | $29,614,000 | N/A | 9.91% | Monthly | 4.01% | N/A | N/A | N/A | N/A | |
| FCCV | 2020-06-05 | 0.39% | $139,700,000 | 7.06 | 3.08% | Quarterly | 0.99% | 12.79% | N/A | N/A | N/A | |
| FST | 2001-11-30 | 0.67% | $69,965,022 | 11.56 | 1.60% | Quarterly | 6.46% | 11.79% | 8.83% | N/A | N/A | |
| FLCD | 2019-02-13 | 0.06% | $198,070,000 | 12.77 | 3.20% | Quarterly | 6.05% | 9.70% | N/A | N/A | N/A | |
| HLIF | 2022-06-08 | 0.79% | $107,270,000 | N/A | 8.00% | Monthly | 0.24% | N/A | N/A | N/A | N/A | |
| HXT | 2010-09-13 | 0.04% | $3,745,125,989 | N/A | N/A | N/A | 4.84% | 10.71% | 9.87% | 8.21% | N/A | |
| PXC | 2012-01-26 | 0.49% | $174,577,110 | 12.67 | 3.52% | Quarterly | 3.73% | 14.92% | 10.34% | 7.77% | N/A | |
| QCN | 2018-01-24 | 0.04% | $1,357,187,206 | 12.58 | 3.34% | Quarterly | 4.73% | 10.06% | 9.64% | N/A | N/A | |
| MCLC | 2017-04-10 | 0.40% | $321,170,000 | N/A | 2.75% | Semi-Annually | 5.77% | 12.61% | 10.05% | N/A | N/A | |
| NSCE | 2020-01-23 | 0.69% | N/A | 20.43 | 1.11% | Quarterly | 13.79% | 12.78% | N/A | N/A | N/A | |
| RCD | 2014-01-09 | 0.42% | $140,520,000 | 13.24 | 3.98% | Monthly | 5.25% | 12.00% | 9.44% | 6.46% | N/A | |
| TTP | 2016-03-22 | 0.05% | $1,620,910,000 | N/A | 2.89% | Quarterly | 4.74% | 10.04% | 9.63% | N/A | N/A | |
| VDY | 2011-10-21 | 0.22% | $2,360,000,000 | N/A | 2.64% | Monthly | 0.76% | 13.25% | 10.07% | 8.01% | N/A | |
| Manager | ETF | Inception | MER | AUM | P/E | Yield | Distributions | 1Y | 3Y | 5Y | 10Y | 15Y |
 |  |  |  |  |  |
|---|---|---|---|---|---|
| Advice | InvestCAN | InvestRESP | InvestUSA | RetireCAN | RetireMGN |
| $500.00 CAD $400.00 USD | $99.99 CAD | $79.99 USD | $99.99 CAD | $12.99 CAD $9.99 USD |
 Rishi Vikram2024-06-03Nic is client focused advisor . Honest advice is rare in today’s world But Nic gave good ,Simple and to the point information.
 Sunny2024-02-29Nic's vast knowledge in financial investments is exceptional. Highly recommended.
 Peter Vigna2024-01-27Nic is the best source for financial education on social media best etf recommendations.
 519 Painting2023-05-01Nick was a tremendous help with our financial planning for our new company!
 Shiella A2022-06-30Nic is professional, intuitive, personable and passionate about his role. We are so gald to have Nic as our financial advisor; our portfolios are well managed and we have been happy with the outcomes over the years. Nic always goes out of his way to help us. We had a bad experience with our Canada life mortgage broker, his lack of support and responsiveness almost cost our family a great opportunity so we had to move on. We honestly wish Nic was able to handle our mortgage needs as well. This will ensure that all our service needs will be well managed. Thank you Nic for everything you do!
 Jake Thuss2022-06-25Nic is the best financial advisor I have come across in London, Ontario. He knowledgeably helped us with our investments, life insurance and a mortgage. He is a great financial planner to deal with!
 John Vella2021-06-10This was my first experience with a financial planner. Nic took the time to explain everything to me. He is very patient and thorough. We talked about my goals and plans for retirement. We also talked about my comfort level when it comes to the the ups and downs of investing. I felt very comfortable with Nic. He is down to earth and very knowledgeable. I would highly recommend Nic to anyone needing a financial planner. I feel much more comfortable with my investment plan because of Nic and look forward to working with him for all my investment needs.
 Jimal Isovski2021-05-11My experience dealing with Nic was flawless. He was extremely informative, supportive and organized when dealing with all my questions and investments. He truly looks out for his clients and does whatever it takes to go above and beyond for their success.
 Karen Campbell2021-05-10Nic always has your best interest in mind. Very knowledgeable, respectful of your time and very keen. Trust-worthy too.