ABNB Stock Analysis
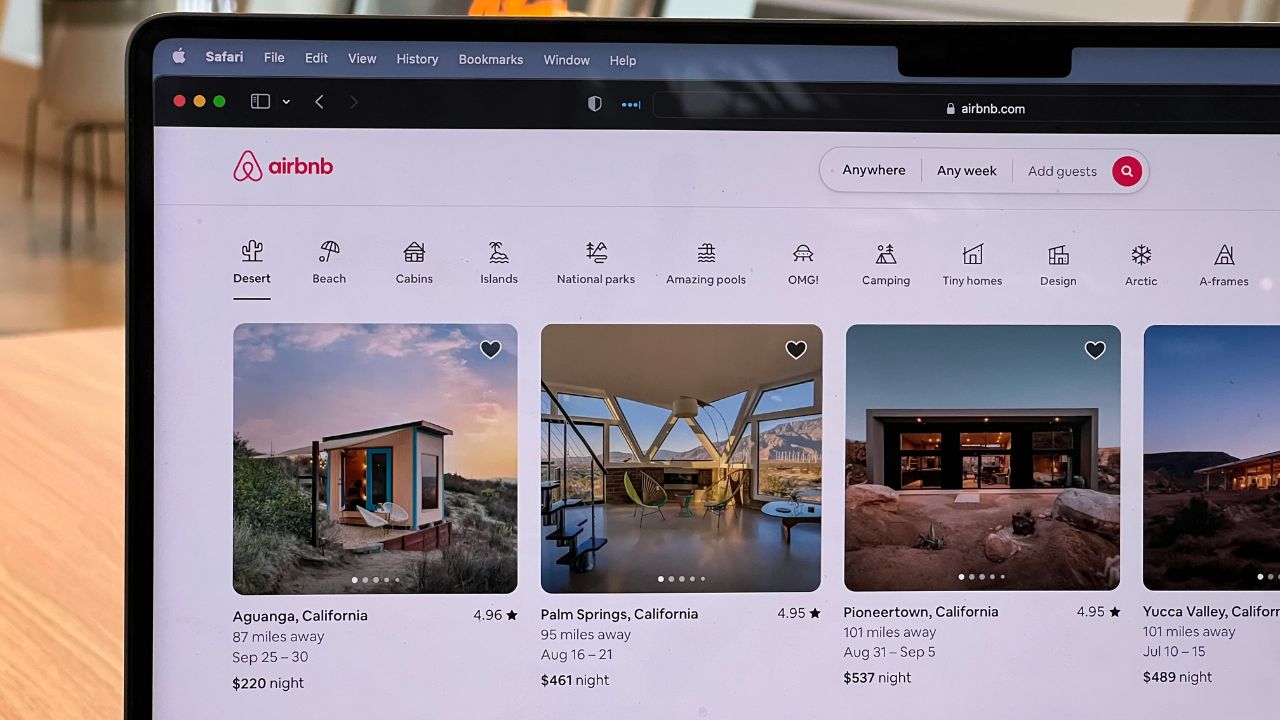
Airbnb, Inc. (ABNB) operates a platform that enables hosts to offer stays and experiences to guests worldwide. The company’s marketplace connects hosts and guests online or through mobile devices to book spaces and experiences. It primarily offers private rooms, primary homes, and vacation homes. The company was formerly known as AirBed & Breakfast, Inc. and changed its name to Airbnb, Inc. in November 2010. Airbnb, Inc. was founded in 2007 and is headquartered in San Francisco, California.
Is ABNB a Good Investment?
Quickly compare ABNB to similar investments focused on the consumer discretionary sector by performance, yield, volatility, and other metrics to decide which stock will fit into your portfolio.
| Ticker | Market Cap | Beta | P/E | Yield | EV/EBITDA | P/B | P/S | C/S | Current | Margin | ROIC | REV Y/Y | 1Y |
|---|---|---|---|---|---|---|---|---|---|---|---|---|---|
| ABNB | $93,951,000,000 | 1.19 | 19.81 | N/A | 38.97 | 7.05 | 5.62 | 25.89 | 1.44 | 82.83% | 11.91% | 17.60% | 1.87% |
| AMZN | $2,006,000,000,000 | 1.15 | 53.83 | N/A | 20.20 | 0.22 | 0.08 | 376.26 | 1.07 | 46.98% | 8.22% | 12.54% | 43.09% |
| BABA | $186,923,000,000 | 0.32 | 18.14 | 2.51% | 47.39 | 1.61 | 1.69 | 28.68 | 1.79 | 37.70% | 6.78% | 8.34% | -17.50% |
| CCL | $24,146,000,000 | 2.69 | 25.96 | N/A | 9.69 | 1.63 | 0.48 | 3.99 | 0.28 | 33.70% | 3.98% | 34.03% | 4.42% |
| DECK | $22,167,000,000 | 1.06 | 29.85 | N/A | 23.74 | 4.92 | 2.42 | 126.26 | 3.39 | 55.63% | 34.49% | 18.21% | 62.72% |
| DKS | $16,795,000,000 | 1.68 | 17.06 | 2.07% | 7.76 | 3.80 | 0.76 | 37.16 | 1.71 | 34.92% | 15.04% | 5.20% | 56.74% |
| DRI | $17,140,000,000 | 1.29 | 16.83 | 3.92% | 11.23 | 7.78 | 1.53 | 1.59 | 0.38 | 21.16% | 12.16% | 8.60% | -15.71% |
| EXPE | $18,000,000,000 | 1.78 | 25.78 | N/A | 7.13 | 9.44 | 1.11 | 53.37 | 0.79 | 87.75% | 6.77% | 8.11% | 14.18% |
| F | $55,551,000,000 | 1.63 | 14.41 | 4.29% | 3.08 | 1.14 | 0.27 | 24.84 | 1.17 | 9.17% | 2.00% | 7.54% | -0.36% |
| GM | $55,081,000,000 | 1.44 | 5.90 | 0.99% | 2.00 | 0.85 | 0.31 | 58.97 | 1.16 | 11.14% | 4.39% | 8.79% | 23.03% |
| GPC | $19,259,000,000 | 0.93 | 15.41 | 2.89% | 10.75 | 5.76 | 1.10 | 6.01 | 1.14 | 36.90% | 10.49% | 2.40% | -10.90% |
| HD | $355,454,000,000 | 0.99 | 24.01 | 2.50% | 16.36 | 312.86 | 2.15 | 4.14 | 1.34 | 33.38% | 28.36% | -2.52% | 13.26% |
| LKQ | $12,037,000,000 | 1.29 | 14.55 | 2.66% | 8.93 | 2.52 | 1.09 | 0.87 | 1.70 | 40.21% | 10.75% | 11.14% | -20.86 |
| LVS | $30,599,000,000 | 1.12 | 19.84 | 1.95% | 10.82 | 9.03 | 3.32 | 5.78 | 1.30 | 49.82% | 10.82% | 112.05% | -27.23% |
| MGM | $13,730,000,000 | 2.25 | 16.71 | N/A | 7.20 | 3.66 | 0.84 | 9.18 | 1.51 | 47.08% | 4.04% | 17.87% | -11.79% |
| NVR | $26,401,000,000 | 1.17 | 17.57 | N/A | 10.93 | 3.71 | 1.71 | 906.88 | 4.70 | 24.30% | 31.90% | -6.69% | 35.38% |
| PHM | $26,242,000,000 | 1.62 | 10.00 | 0.64% | 6.65 | 1.02 | 0.64 | 8.18 | 4.60 | 29.38% | 22.34% | -1.09% | 60.94% |
| PKG | $17,371,000,000 | 0.78 | 24.21 | 2.61% | 11.57 | 3.13 | 1.60 | 17.43 | 2.46 | 21.77% | 12.80% | -6.16% | 40.84% |
| RCL | $43,309,000,000 | 2.63 | 21.47 | N/A | 11.66 | 3.00 | 0.96 | 5.90 | 0.19 | 44.06% | 9.02% | 38.22% | 66.44% |
| ROST | $47,868,000,000 | 1.09 | 24.20 | 1.02% | 16.58 | 8.25 | 1.94 | 17.41 | 1.54 | 27.36% | 16.65% | 9.98% | 27.90% |
| SCI | $10,951,000,000 | 0.85 | 21.55 | 1.60% | 12.22 | 7.40 | 2.77 | 1.45 | 0.62 | 26.63% | 6.03% | 2.27% | 12.57% |
| TOL | $13,767,000,000 | 1.66 | 9.19 | 0.70% | 6.46 | 0.84 | 0.55 | 10.04 | 4.63 | 26.36% | 14.87% | -0.01% | 70.38% |
| TSCO | $28,942,000,000 | 0.81 | 26.11 | 1.64% | 16.57 | 11.22 | 1.65 | 5.52 | 1.40 | 35.92% | 16.73% | 1.18% | 25.20% |
| TSLA | $805,719,000,000 | 2.31 | 64.45 | N/A | 53.26 | 7.91 | 5.23 | 15.00 | 1.72 | 18.25% | 10.87% | 10.12% | -10.21% |
| ULTA | $18,653,000,000 | 1.37 | 15.26 | N/A | 9.43 | 10.99 | 2.22 | 11.96 | 1.76 | 39.09% | 30.30% | 7.64% | -15.45% |
| WSM | $18,891,000,000 | 1.74 | 18.04 | 1.55% | 11.39 | 6.52 | 1.81 | 13.36 | 1.55 | 42.62% | 25.04% | -10.34% | 12.51% |


