ETSX ETF Review
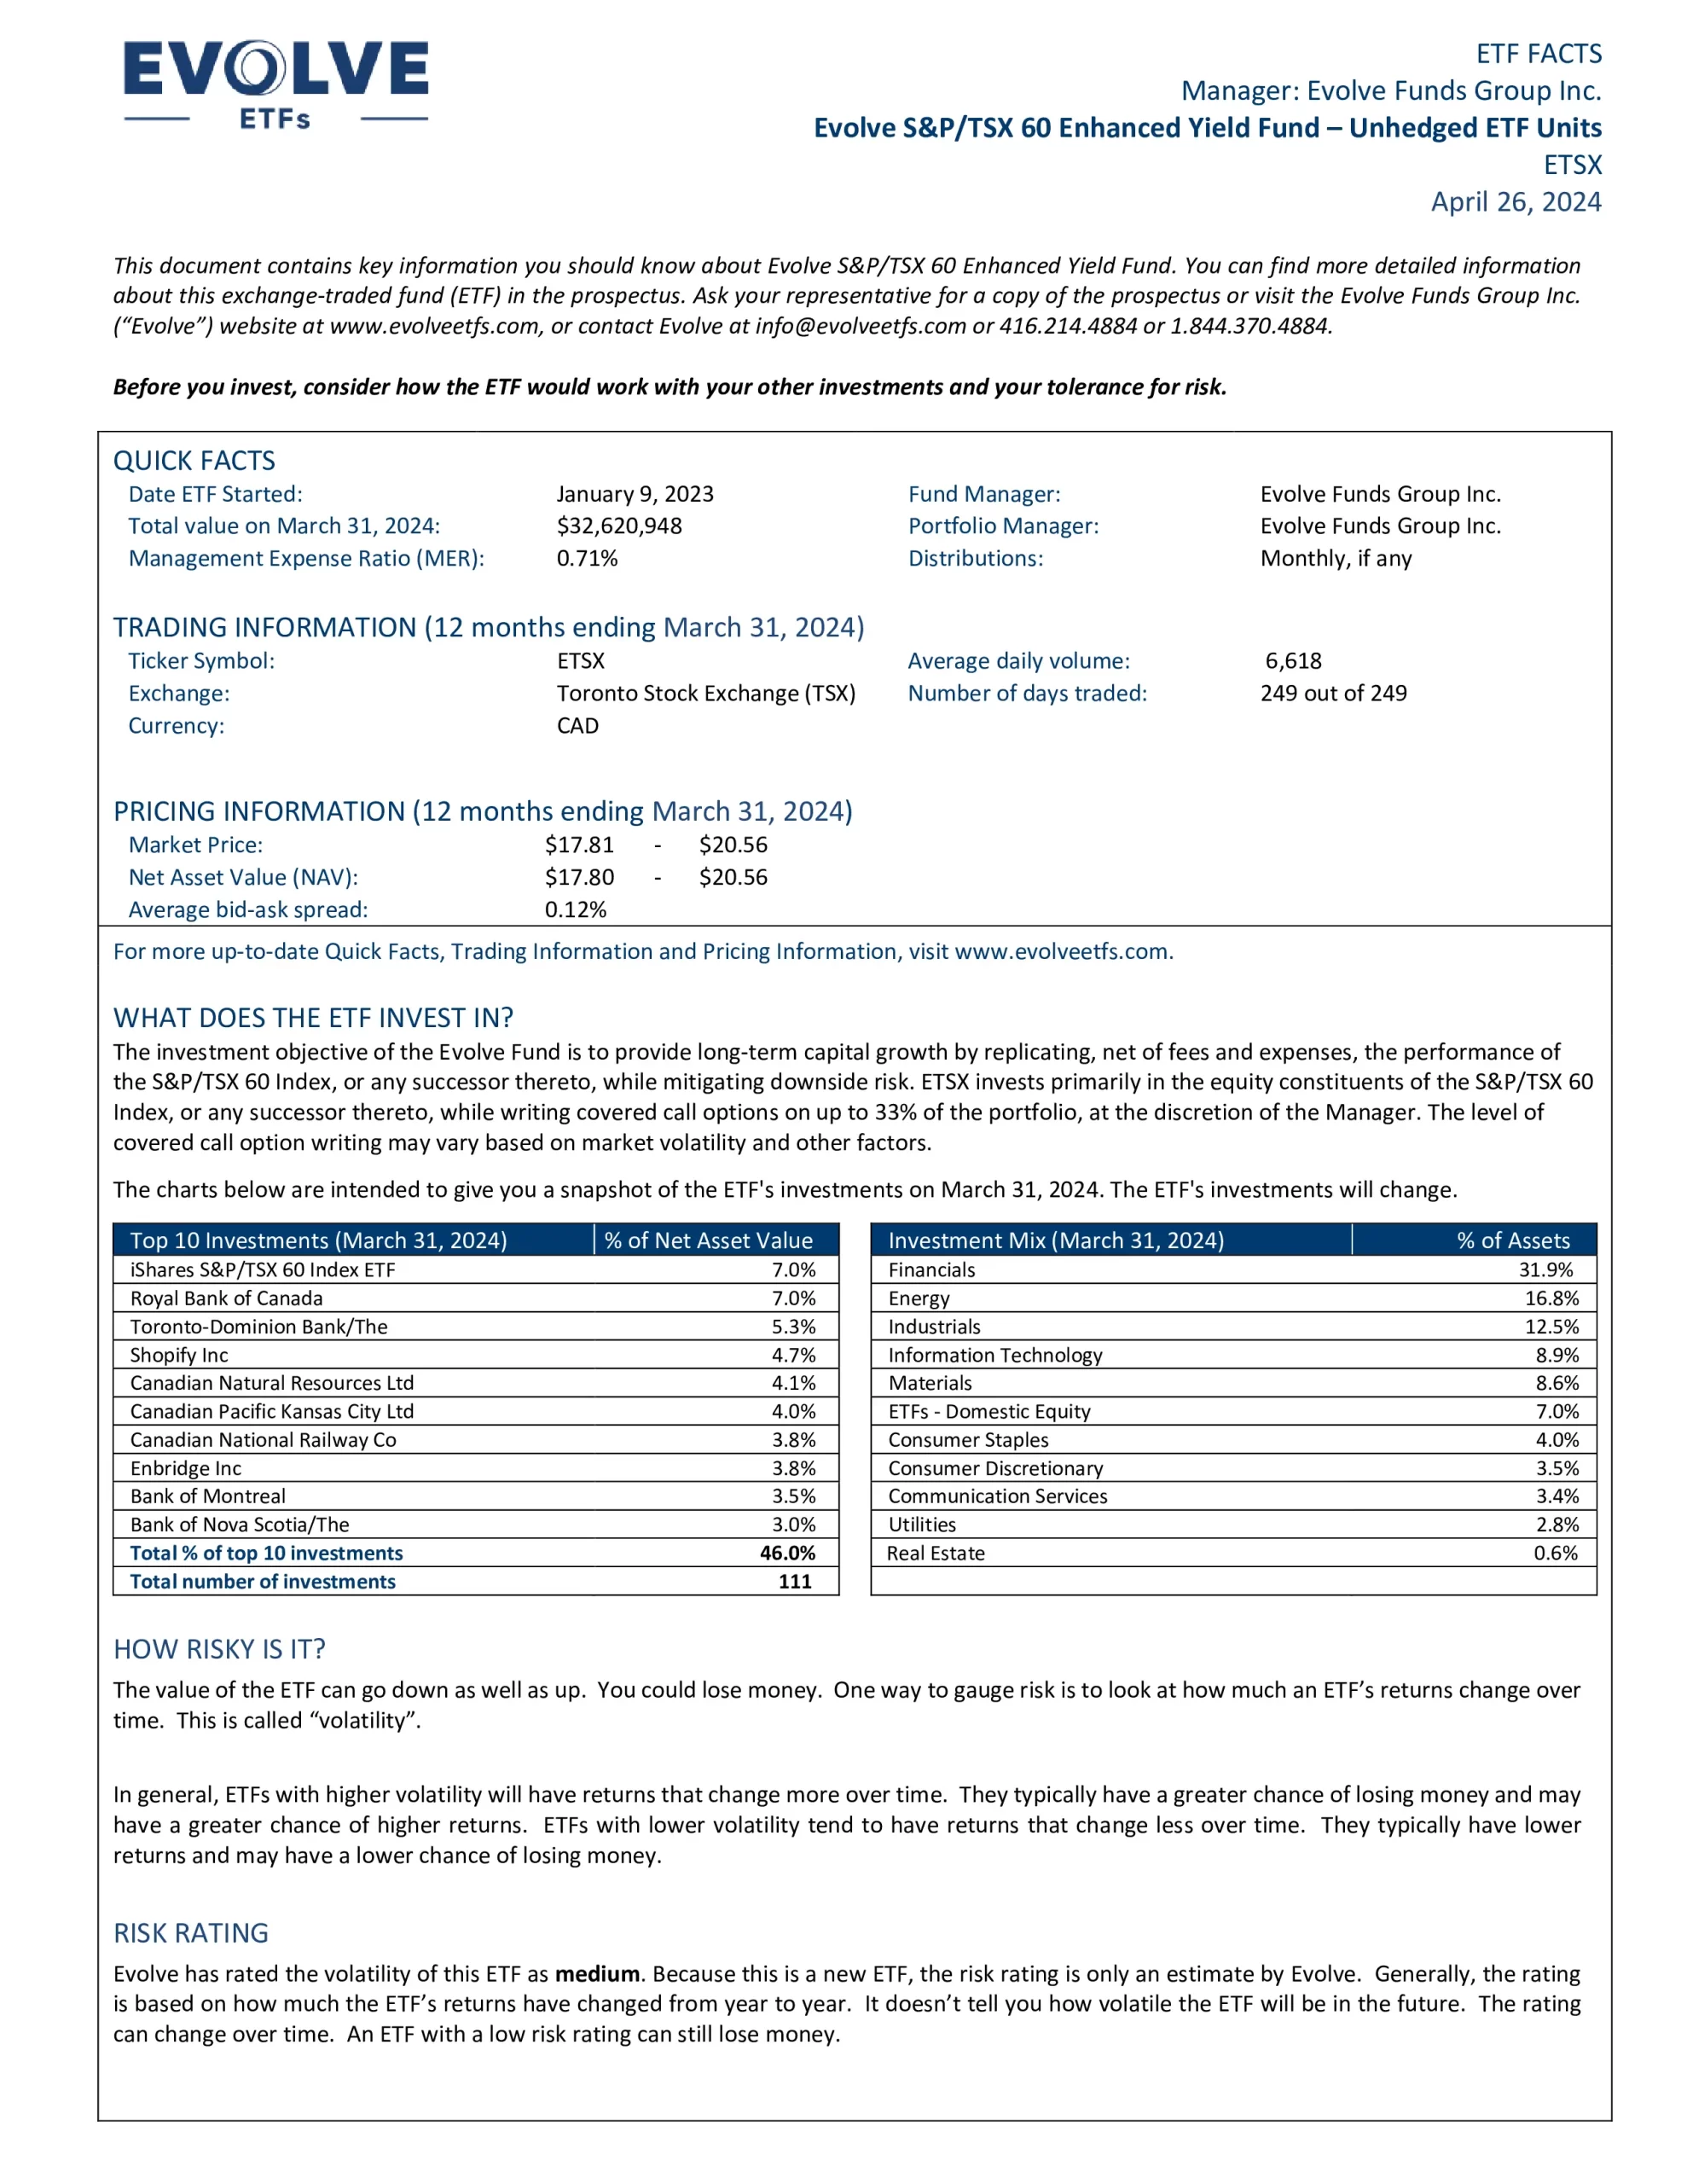
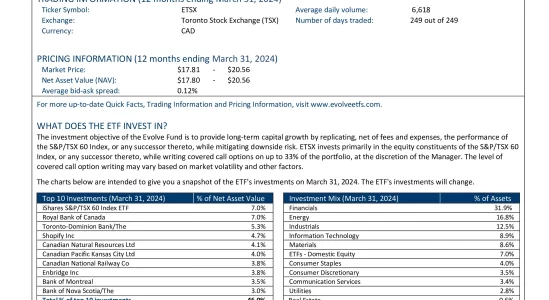
The investment objective of the Evolve S&P/TSX 60 Enhanced Yield Fund CAD Unhedged (ETSX) is to provide long-term capital growth by replicating, net of fees and expenses, the performance of the S&P/TSX 60 Index, or any successor thereto, while mitigating downside risk. ETSX invests primarily in the equity constituents of the S&P/TSX 60 Index, or any successor thereto, while writing covered call options on up to 33% of the portfolio, at the discretion of the Manager. The level of covered call option writing may vary based on market volatility and other factors.

Top 10 ETSX Holdings
The top 10 investments of ETSX account for 46.0% of the 111 holdings. This table shows the names of the individual holdings that are subject to change.
| Ticker | Name | Weight |
|---|---|---|
| RY | Royal Bank of Canada | 7.89% |
| CNDX | Global X S&P/TSX 60 Index ETF | 5.06% |
| TD | Toronto-Dominion Bank/The | 4.99% |
| SHOP | Shopify Inc | 4.00% |
| CNQ | Canadian Natural Resources Ltd | 3.88% |
| ENB | Enbridge Inc | 3.83% |
| CP | Canadian Pacific Kansas City Ltd | 3.82% |
| CNR | Canadian National Railway Co | 3.41% |
| BN | Brookfield Corp | 3.17% |
| BMO | Bank of Montreal | 3.14% |
Is ETSX a Good Investment?
Quickly compare ETSX to similar investments focused on Canadian equity ETFs by risk, fees, performance, yield, volatility, and other metrics to decide which ETF will fit into your portfolio.
| Manager | ETF | Risk | Inception | MER | AUM | Holdings | Beta | P/E | Yield | Distributions | 1Y | 3Y | 5Y | 10Y | 15Y |
|---|---|---|---|---|---|---|---|---|---|---|---|---|---|---|---|
| XIC | Medium | 2001-02-16 | 0.06% | $12,748,173,743 | 227 | 1.00 | 13.40 | 2.82% | Quarterly | 12.06% | 5.92% | 9.26% | 6.93% | 8.18% | |
| ZCN | Medium | 2009-05-29 | 0.06% | $8,224,580,000 | 228 | 1.00 | N/A | 3.15% | Quarterly | 12.04% | 5.92% | 9.26% | 6.93% | 7.71% | |
| KNGC | Medium to High | 2024-05-30 | N/A | N/A | N/A | N/A | N/A | N/A | Monthly | N/A | N/A | N/A | N/A | N/A | |
| FXM | Medium to High | 2012-02-13 | 0.65% | $305,610,000 | 31 | 0.86 | 9.47 | 2.96% | Quarterly | 10.45 | 7.04% | 11.60% | 6.31% | N/A | |
| CCEI | Medium | 2021-03-31 | 0.05% | $311,119,756 | 222 | N/A | 12.66 | 3.22% | Quarterly | 6.46% | N/A | N/A | N/A | N/A | |
 | DRFC | Medium | 2018-09-27 | 0.47% | $227,310,000 | 77 | 0.91 | 13.24 | 2.38% | Quarterly | 14.21% | 10.43% | 9.91% | N/A | N/A |
 | DXC | Low to Medium | 2017-01-20 | 0.72% | $243,160,000 | 40 | 0.84 | N/A | 2.55% | Monthly | 6.05% | 8.27% | 9.90% | N/A | N/A |
| ETSX | Medium | 2023-01-09 | 0.71% | $29,614,000 | 95 | N/A | N/A | 9.91% | Monthly | 4.01% | N/A | N/A | N/A | N/A | |
 | FCCV | Medium | 2020-06-05 | 0.39% | $139,700,000 | 66 | 1.11 | 7.06 | 3.08% | Quarterly | 4.77% | 9.60% | N/A | N/A | N/A |
 | FST | Medium | 2001-11-30 | 0.67% | $69,965,022 | 26 | 0.94 | 11.56 | 1.60% | Quarterly | 18.01% | 11.11% | 10.05% | 7.91% | 8.31% |
| FLCD | Medium | 2019-02-13 | 0.06% | $198,070,000 | 172 | 0.99 | 12.77 | 3.20% | Quarterly | 6.05% | 9.70% | N/A | N/A | N/A | |
| HXT | Medium | 2010-09-13 | 0.04% | $3,745,125,989 | 60 | 1.01 | N/A | N/A | N/A | 11.09% | 5.90% | 9.34% | 7.47% | N/A | |
| GCSC | Medium | 2021-03-31 | 0.67% | $22,325,359 | 38 | 0.88 | 16.57 | 1.64% | Quarterly | 14.39% | 6.95% | N/A | N/A | N/A | |
| HLIF | Medium | 2022-06-08 | 0.79% | $107,270,000 | 30 | N/A | N/A | 8.00% | Monthly | 0.24% | N/A | N/A | N/A | N/A | |
| PXC | Medium | 2012-01-26 | 0.49% | $174,577,110 | 91 | 0.96 | 12.67 | 3.52% | Quarterly | 8.93% | 10.68% | 9.62% | 7.38% | N/A | |
| QCN | Medium | 2018-01-24 | 0.04% | $1,357,187,206 | 279 | 0.99 | 12.58 | 3.34% | Quarterly | 4.73% | 10.06% | 9.64% | N/A | N/A | |
| MCLC | Medium | 2017-04-10 | 0.40% | $321,170,000 | 82 | 0.96 | N/A | 2.75% | Semi-Annually | 10.12% | 10.33% | 9.30% | N/A | N/A | |
| NSCE | Medium | 2020-01-23 | 0.69% | $1,645,300,000 | 34 | 0.73 | 20.43 | 1.11% | Quarterly | 11.28% | 9.86% | N/A | N/A | N/A | |
| RCD | Medium | 2014-01-09 | 0.42% | $140,520,000 | 59 | 0.93 | 13.24 | 3.98% | Monthly | 7.74% | 8.41% | 8.63% | 5.84% | N/A | |
| SITC | Medium | 2020-11-03 | 0.06% | $71,560,000 | 57 | 0.99 | 12.87 | 2.86% | Quarterly | 12.20% | 6.37% | N/A | N/A | N/A | |
| TTP | Medium | 2016-03-22 | 0.05% | $1,620,910,000 | 279 | 0.99 | N/A | 2.89% | Quarterly | 4.74% | 10.04% | 9.63% | N/A | N/A | |
| VCN | Medium | 2013-08-02 | 0.05% | $6,730,000,000 | 173 | 0.99 | 13.46 | 2.97% | Quarterly | 12.37% | 6.20% | 9.31% | 6.73% | N/A |