More information about iShares China Large-Cap ETF (FXI) is in its prospectus. Before investing in an Exchange Traded Fund (ETF), it’s important to assess how it fits within your portfolio and aligns with your risk tolerance. Keep in mind that the value of ETFs can fluctuate, and there is always the possibility of losing money. They do not come with guarantees, and you may not recover your full investment. Additionally, buying or selling ETF units may involve commission fees, which can vary depending on the brokerage firm. ETF prices can also experience higher volatility, particularly during market openings and closings.
It’s also essential to be aware of psychological factors like confirmation bias, which can lead investors to make decisions based on incomplete or biased information, reducing the chances of success. Similarly, herding behavior can be a risk, where investors follow the actions of the majority or “crowd,” often influenced by social media, rather than making independent, well-researched choices.
Investing during periods of inflation may seem counterintuitive, but it can be an effective strategy for preserving and growing wealth over time. One popular approach to managing market uncertainty is dollar-cost averaging, which involves investing a fixed amount regularly, regardless of market conditions. This strategy helps avoid trying to time the market and can reduce the impact of loss aversion—a psychological bias that often leads to poor decision-making during market downturns.
It’s also worth noting that a narrower bid-ask spread generally indicates higher liquidity, meaning you’re more likely to execute trades at expected prices. Always consider these factors carefully when making investment decisions, as even ETFs considered low-risk can experience losses under certain market conditions.
FXI ETF Review
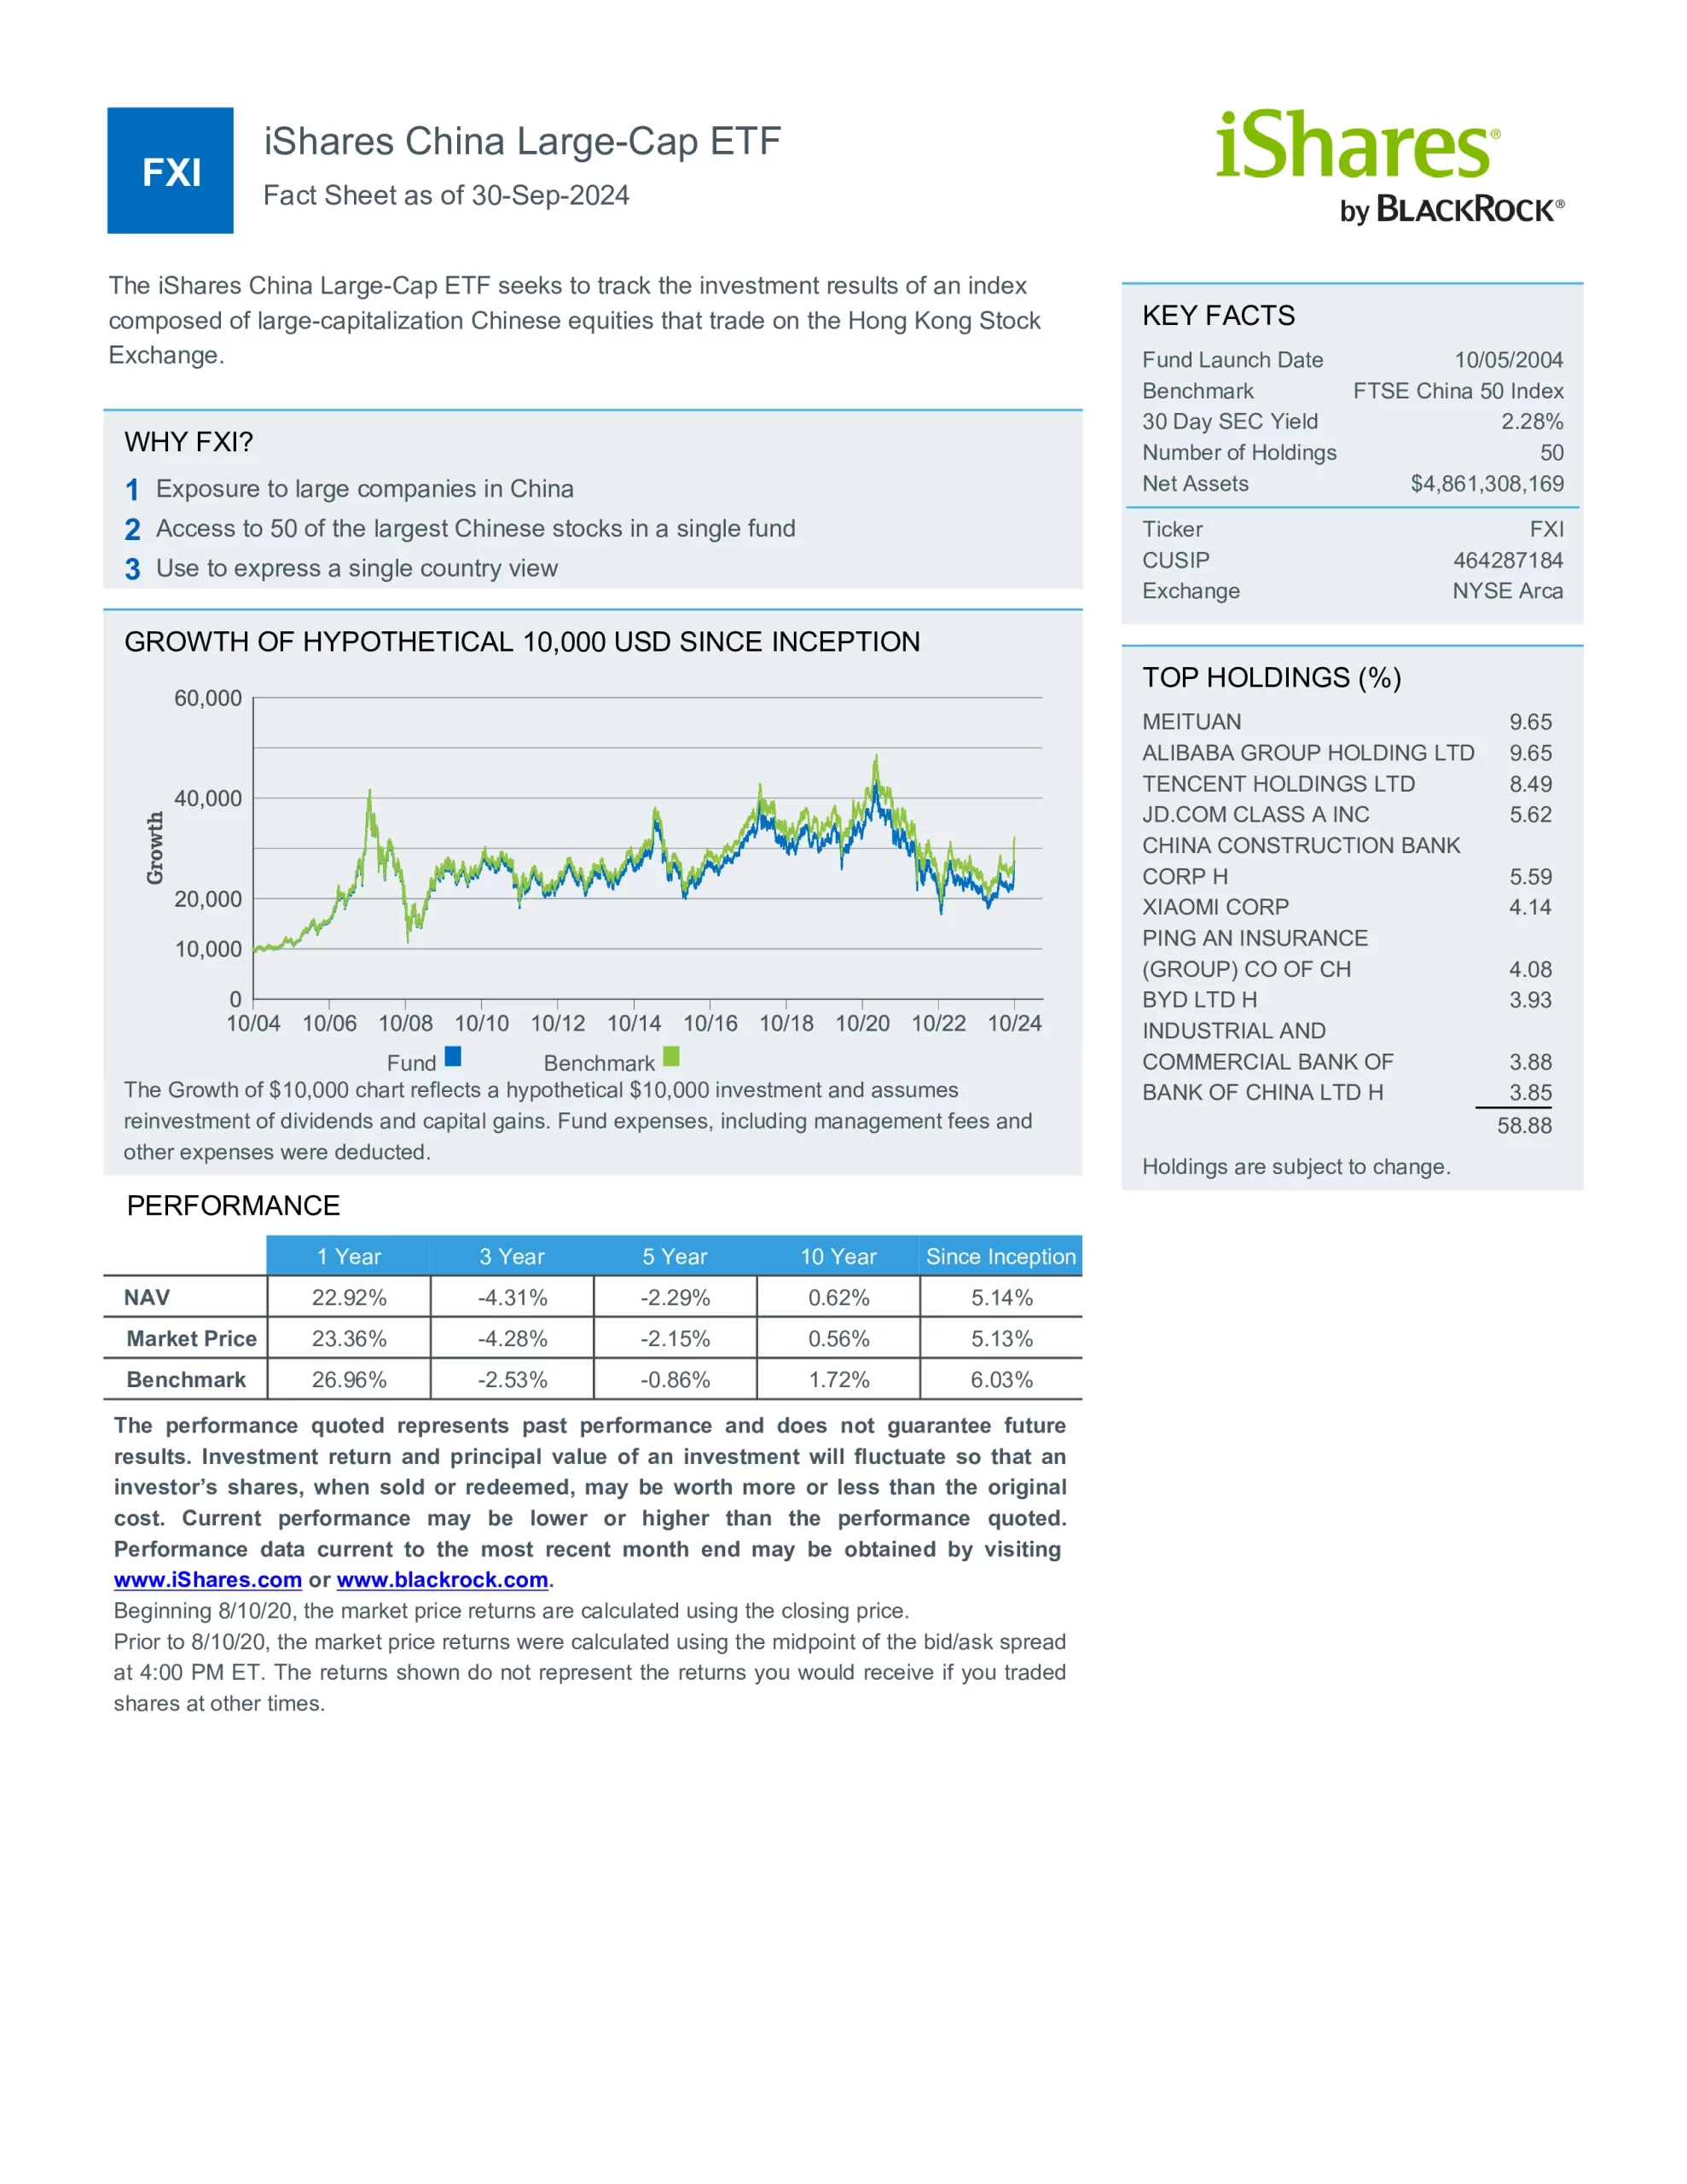
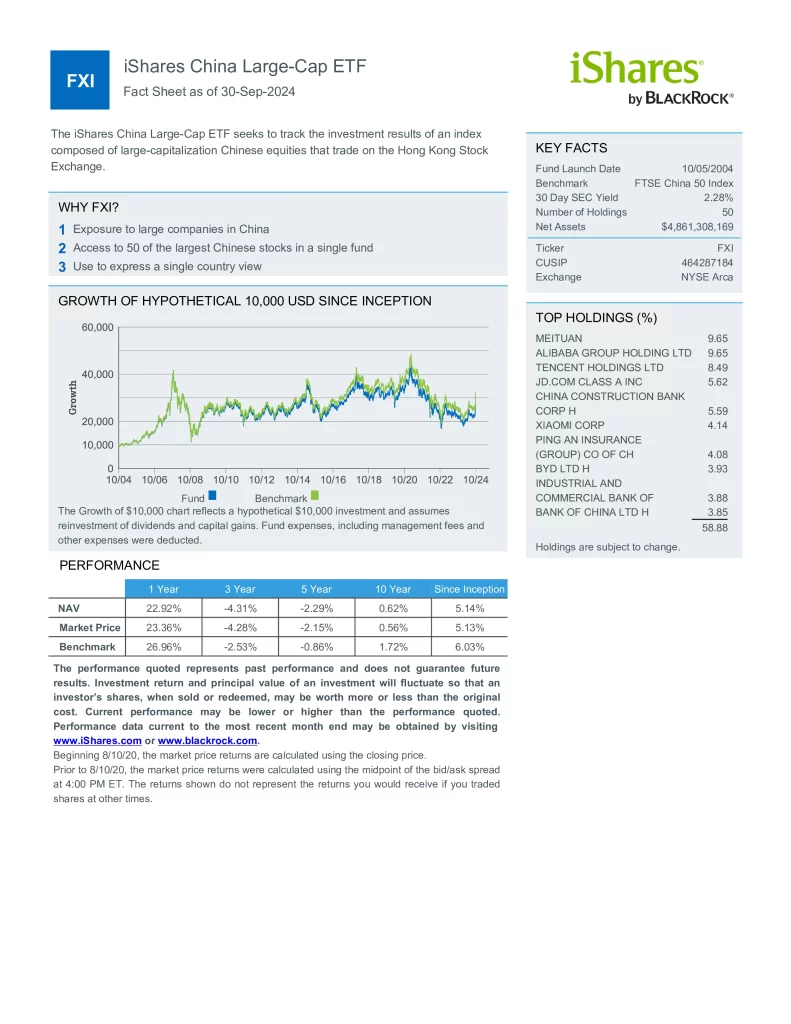
iShares China Large-Cap ETF (FXI) seeks to track the investment results of an index composed of large-capitalization Chinese equities that trade on the Hong Kong Stock Exchange.
- Access to 50 of the largest Chinese stocks in a single fund
- Exposure to large companies in China
- Use to express a single country view
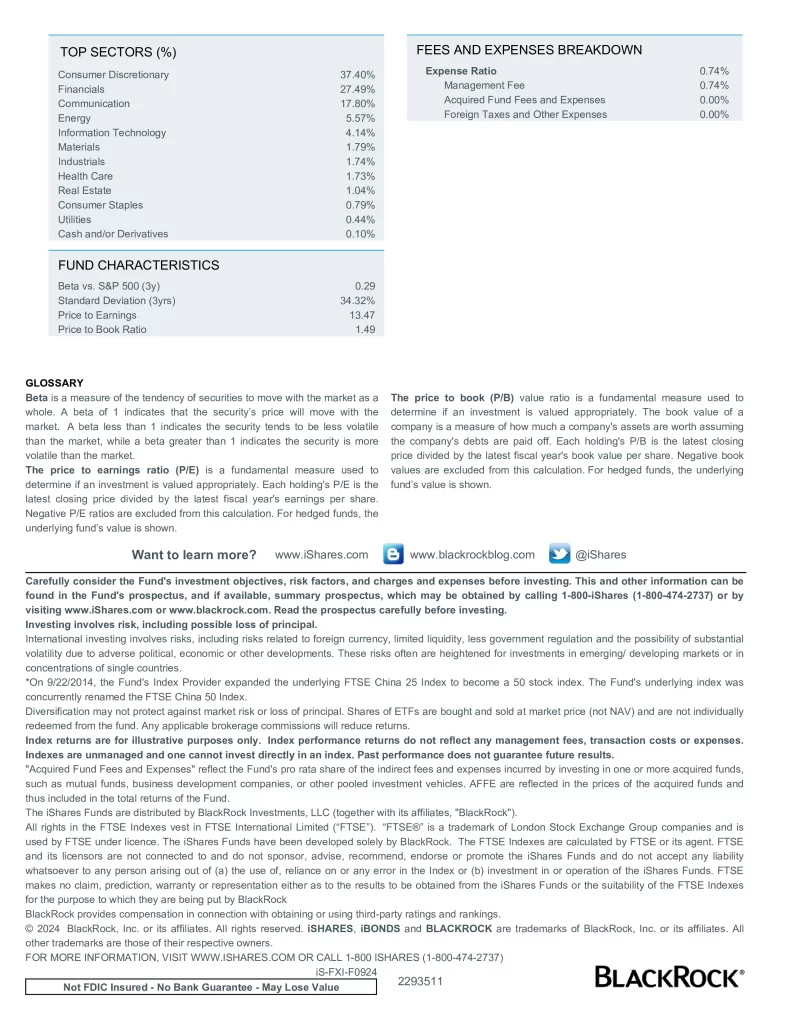
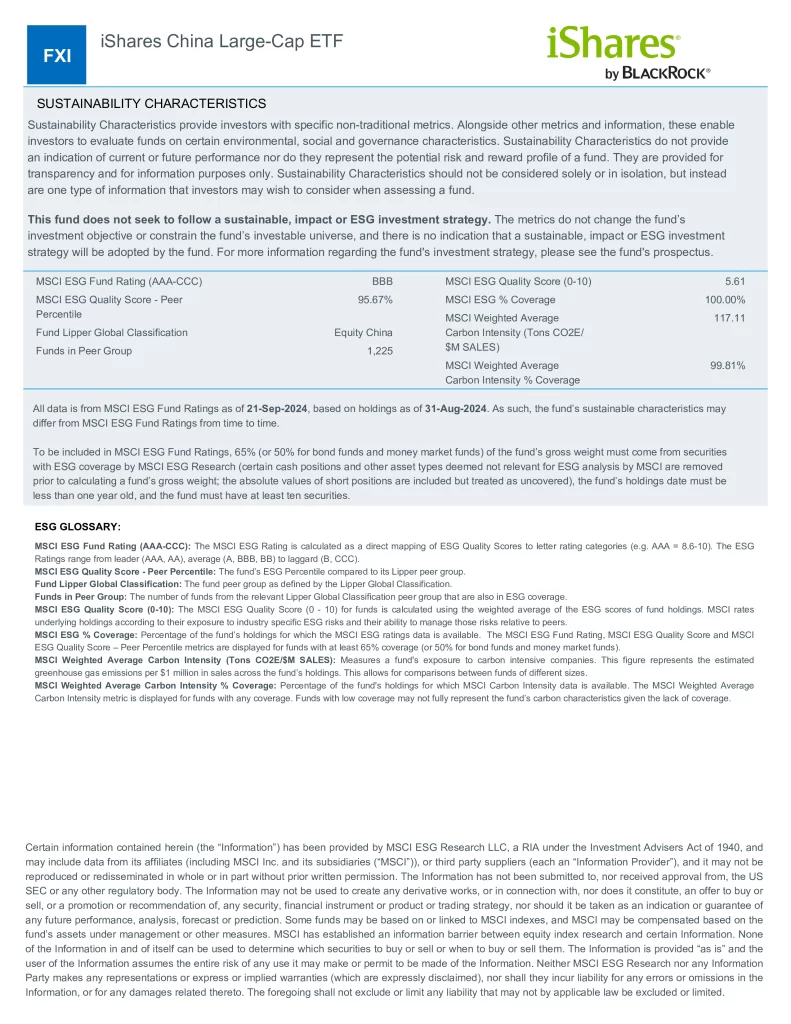
Top 10 FXI Holdings
The top 10 holdings of FXI account for 59.6% of the total fund which consists of 59 diversified investments. This table shows the investment names of the individual holdings that are subject to change.
| Ticker | Name | Weight |
|---|---|---|
| 3690 | MEITUAN | 9.45% |
| 700 | TENCENT HOLDINGS LTD | 8.17% |
| 9988 | ALIBABA GROUP HOLDING LTD | 7.76% |
| 939 | CHINA CONSTRUCTION BANK CORP H | 6.29% |
| 1810 | XIAOMI CORP | 5.96% |
| 9618 | JD.COM CLASS A INC | 5.10% |
| 9961 | TRIP.COM GROUP LTD | 4.42% |
| 1398 | INDUSTRIAL AND COMMERCIAL BANK OF | 4.28% |
| 3988 | BANK OF CHINA LTD H | 4.22% |
| 1211 | BYD LTD H | 3.95% |
XIU Dividend History
FXI currently has a yield of 2.82% and pays distributions semi-annually. Most ETFs will distribute net taxable income to investors at least once a year. This is taxable income if generated from interest, dividends and capital gains by the securities within the ETF. The distributions will either be paid in cash or reinvested in the ETF at the discretion of the manager. This information will be reported in an official tax receipt provided to investors by their broker.
| Ex-Dividend Date | Record Date | Payable Date | Dividend |
|---|---|---|---|
| Dec 17, 2024 | Dec 17, 2024 | Dec 20, 2024 | $0.451095 |
| Jun 11, 2024 | Jun 11, 2024 | Jun 17, 2024 | $0.084796 |
| Dec 20, 2023 | Dec 21, 2023 | Dec 27, 2023 | $0.607441 |
| Jun 07, 2023 | Jun 08, 2023 | Jun 13, 2023 | $0.154374 |
| Dec 13, 2022 | Dec 14, 2022 | Dec 19, 2022 | $0.593146 |
| Jun 09, 2022 | Jun 10, 2022 | Jun 15, 2022 | $0.145929 |
| Dec 13, 2021 | Dec 14, 2021 | Dec 17, 2021 | $0.434302 |
| Jun 10, 2021 | Jun 11, 2021 | Jun 16, 2021 | $0.151017 |
Is FXI a Good ETF?
Quickly compare and contrast FXI to other investments focused on Chinese equities by fees, performance, yield, and other metrics to decide which ETF fits in your portfolio.
| Manager | ETF | Name | Inception | AUM | MER | P/E | Yield | Beta | Distributions | Holdings | 5Y |
|---|---|---|---|---|---|---|---|---|---|---|---|
| BlackRock | FXI | iShares China Large-Cap ETF | 2004-10-05 | $7,217,347,676 | 0.74% | 8.98 | 2.29% | 1.04 | Semi-Annually | 50 | -3.62% |
| BlackRock | MCHI | iShares MSCI China ETF | 2011-03-29 | $5,415,007,503 | 0.59% | 11.42 | 2.51% | 1.06 | Semi-Annually | 579 | -0.23% |
| Franklin | FLCH | Franklin FTSE China ETF | 2017-11-02 | $152,020,000 | 0.19% | 11.66 | 2.63% | 1.03 | Semi-Annually | 961 | -2.17% |
| Invesco | CQQQ | Invesco China Technology ETF | 2009-12-08 | $686,100,000 | 0.65% | 23.25 | 0.48% | 1.16 | Annually | 151 | -3.23% |
| Invesco | PGJ | Invesco Golden Dragon China ETF | 2004-12-09 | $144,400,000 | 0.67% | 15.93 | 6.01% | 1.30 | Quarterly | 66 | -3.23% |
| KraneShares | KWEB | KraneShares CSI China Internet ETF | 2013-07-31 | $5,613,681,203 | 0.70% | 16.37 | 1.50% | 1.35 | Annually | 33 | -6.25% |
| State Street | GXC | SPDR S&P China ETF | 2007-03-07 | $414,620,000 | 0.59% | 12.70 | 3.02% | 0.99 | Semi-Annually | 1,156 | -2.33% |
| Xtrackers | ASHR | Xtrackers Harvest CSI 300 China A-Shares ETF | 2013-11-06 | $2,880,000,000 | 0.65% | 14.38 | 2.19% | 0.71 | Annually | 287 | 0.87% |
Conclusion
iShares China Large-Cap ETF (FXI) is a convenient way to invest in Chinese large-cap blend stocks. The Fund’s return may not match the return of the underlying index. Growth stocks tend to be more sensitive to changes in their earnings and can be more volatile. Investments focused on a particular sector, such as healthcare, are subject to greater risk, and are more greatly impacted by market volatility than more diversified investments. A value style of investing is subject to the risk that the valuations never improve or that the returns will trail other styles of investing or the overall stock markets. Beta is a measure of risk representing how a security is expected to respond to general market movements.

