
Horizons Conservative TRI ETF Portfolio (HCON.TO) seeks to provide a combination of income and moderate long-term capital growth, primarily by investing in exchange traded funds that provide exposure to a globally diversified portfolio of fixed income and equity securities.
An Exchange Traded Fund (ETF) is a collection of hundreds or thousands of stocks or bonds in a single fund that trades on major stock exchanges. ETFs combine the diversification of mutual funds with lower investment minimum and real-time pricing. The beauty of ETFs is that they are extremely similar to mutual funds; the difference is you purchase these investments on your own with lower fees!
HCON ETF Review
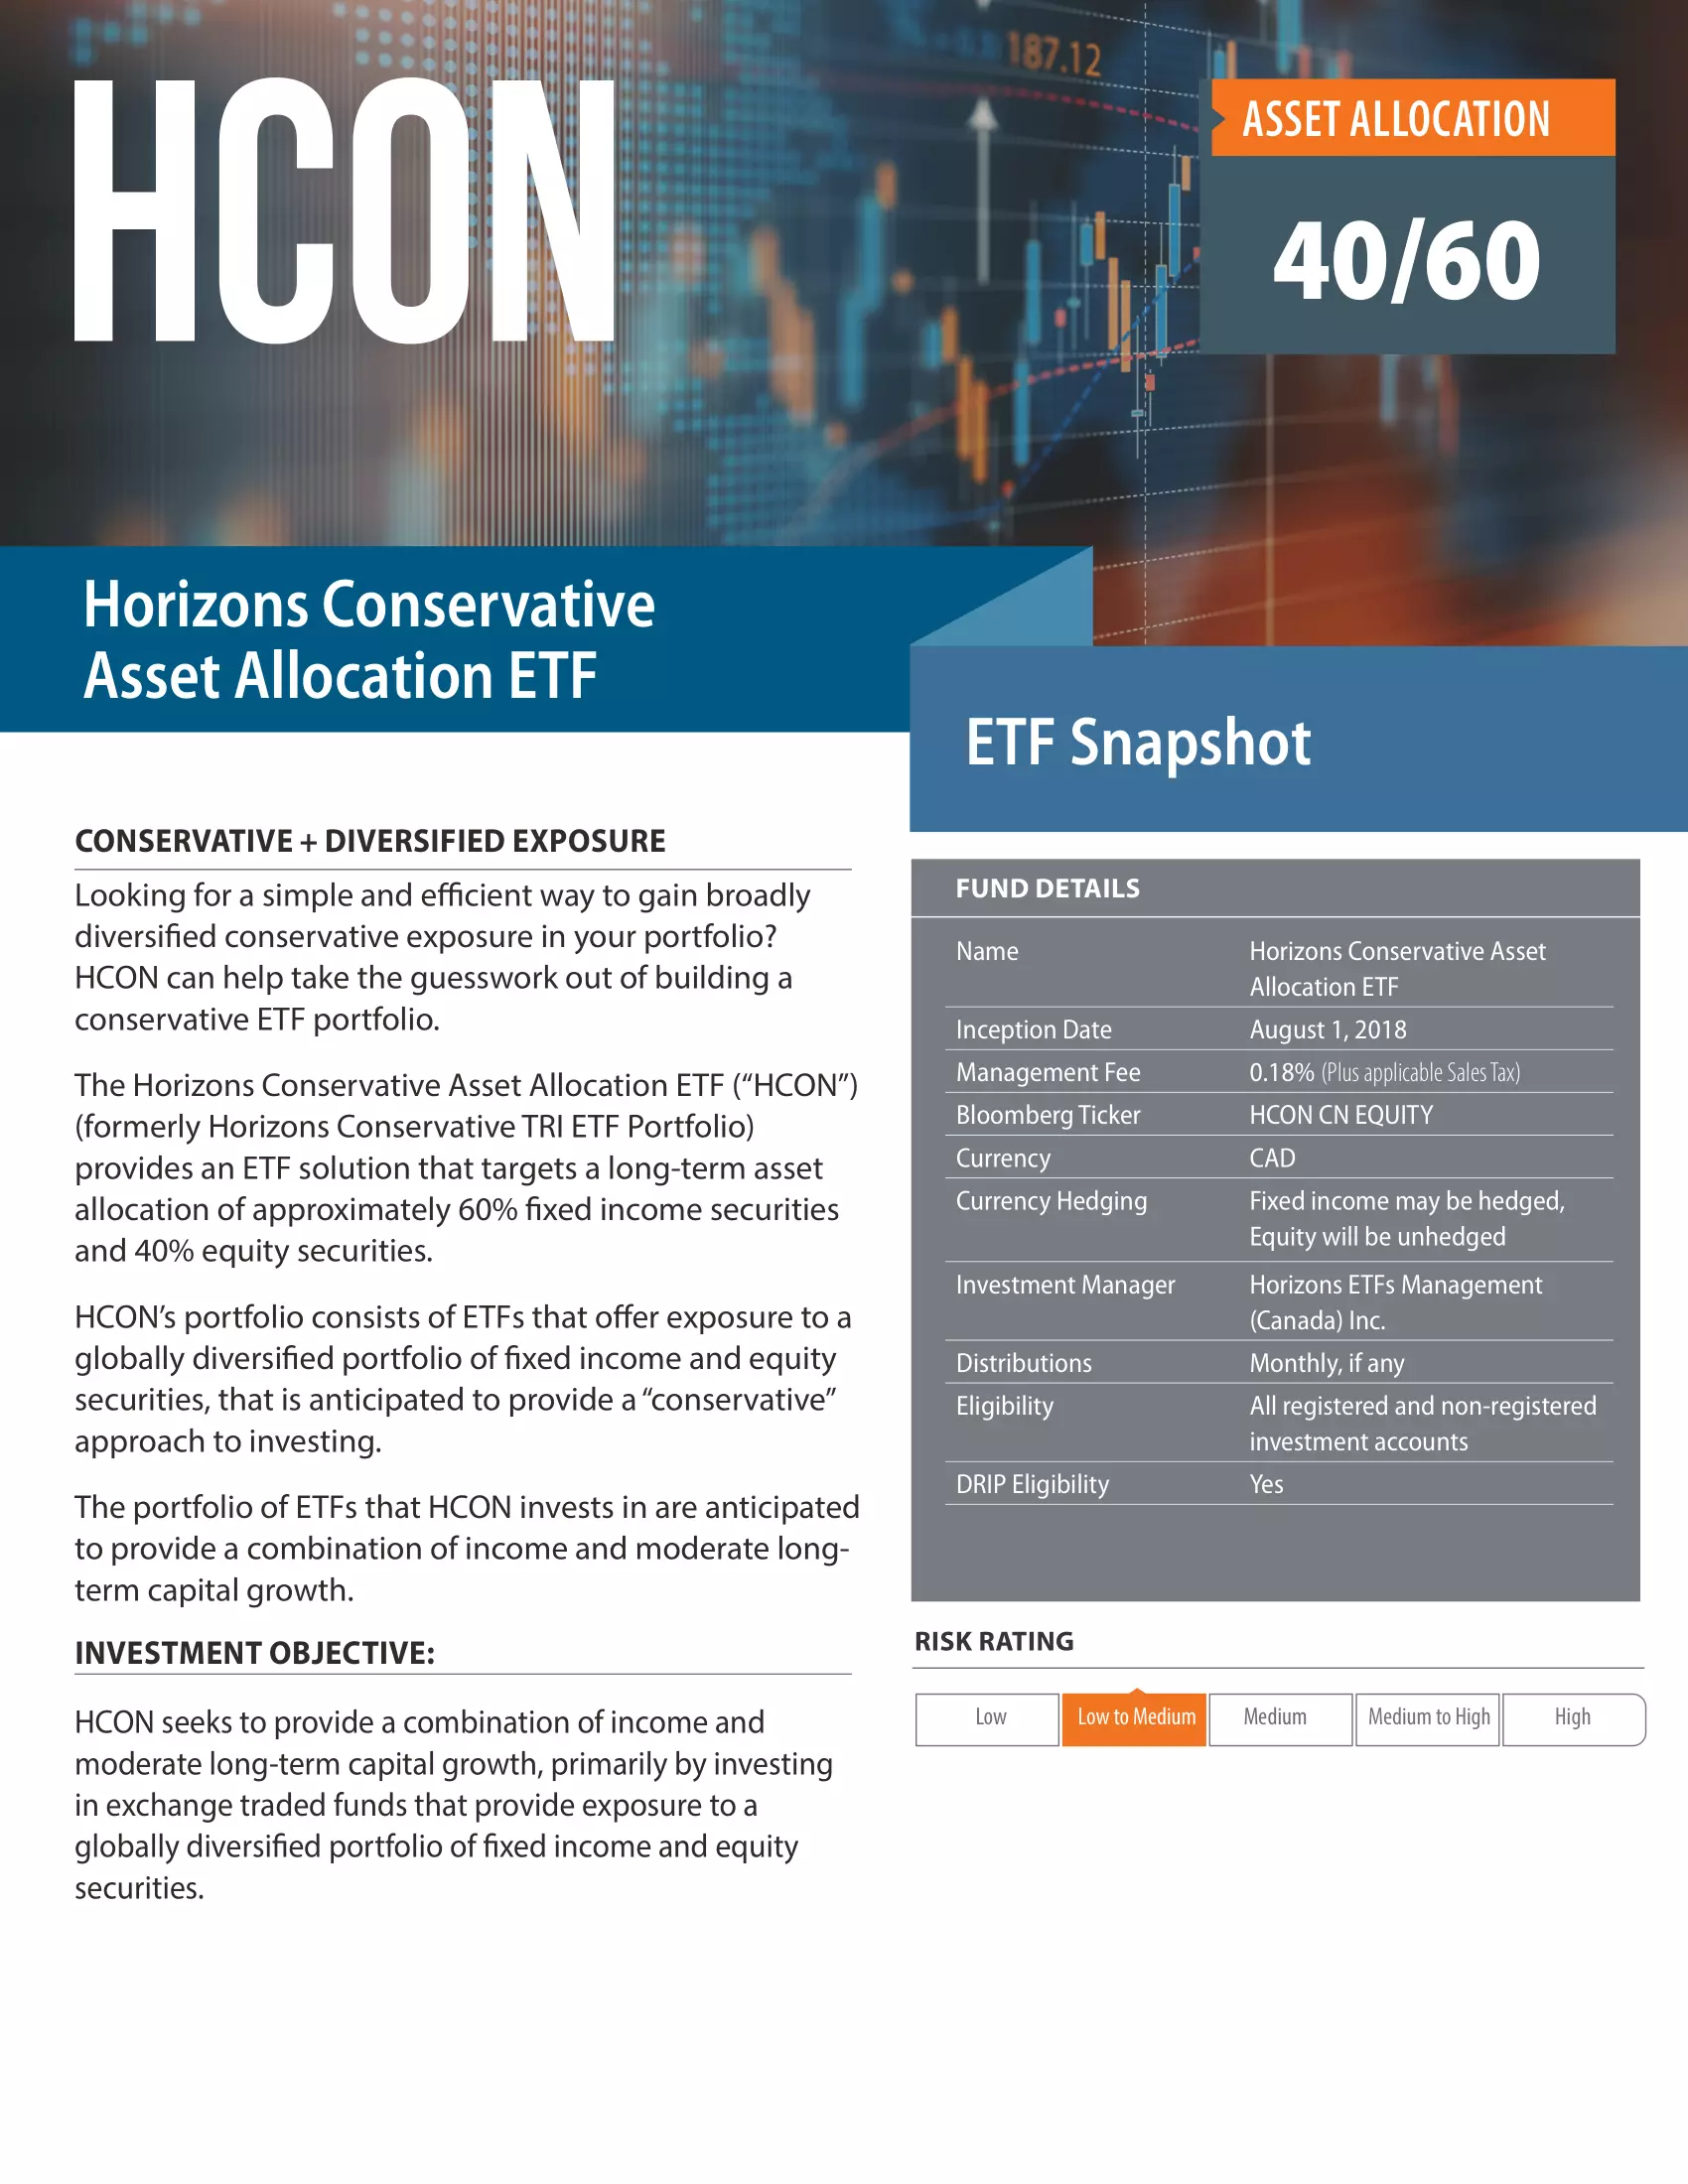
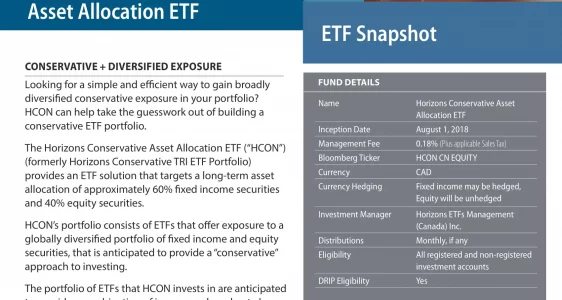
Looking for a simple and efficient way to gain broadly diversified conservative exposure in your portfolio? HCON can help take the guesswork out of building a conservative ETF portfolio. The Horizons Conservative Asset Allocation ETF (HCON), formerly Horizons Conservative TRI ETF Portfolio, provides an ETF solution that targets a long-term asset allocation of approximately 60% fixed-income securities and 40% equity securities. HCON’s portfolio consists of ETFs that offer exposure to a globally diversified portfolio of fixed-income and equity securities, that is anticipated to provide a “conservative” approach to investing. The portfolio of ETFs that HCON invests in is anticipated to provide a combination of income and moderate long-term capital growth.
What is the Best Conservative All-in-One ETF in Canada?
- CSCB.NE: CIBC Sustainable Conservative Balanced Solution
- FCNS.NE: Fidelity All-in-One Conservative ETF Fund
- GCNS.TO: iShares ESG Conservative Balanced ETF Port
- HCON.TO: Horizons Conservative TRI ETF Portfolio
- MCON.TO: Mackenzie Conservative Allocation ETF
- VCNS.TO: Vanguard Conservative ETF Portfolio
- XCNS.TO: iShares Core Conservative Balanced ETF Portfolio
- ZCON.TO: BMO Conservative ETF
Here is a table comparing HCON to similar conservative (40/60) asset allocation ETFs as of June 30, 2023.
| Manager |  | |||||
| ETF | XCNS | ZCON | FCNS | HCON | MCON | VCNS |
| Inception | 2019-08-07 | 2019-02-15 | 2022-01-20 | 2018-08-01 | 2020-09-29 | 2018-01-25 |
| MER | 0.20% | 0.20% | 0.38% | 0.20% | 0.19% | 0.24% |
| AUM | $192,564,699 | $39,440,000 | $120,500,000 | $50,621,100 | $26,739,328 | $469,900,000 |
| Yield | 2.29% | 2.80% | N/A | 2.92% | 2.48% | 2.47% |
| Distributions | Quarterly | Quarterly | Annually | Monthly | Quarterly | Quarterly |
| 1Y | 3.83% | 3.38% | 4.69% | 4.65% | 4.0% | 3.34% |
| 3Y | 0.77% | 0.20% | N/A | 0.91% | 0.7% | 0.17% |
| 5Y | N/A | N/A | N/A | 4.39% | N/A | 3.09% |
| 10Y | N/A | N/A | N/A | N/A | N/A | N/A |