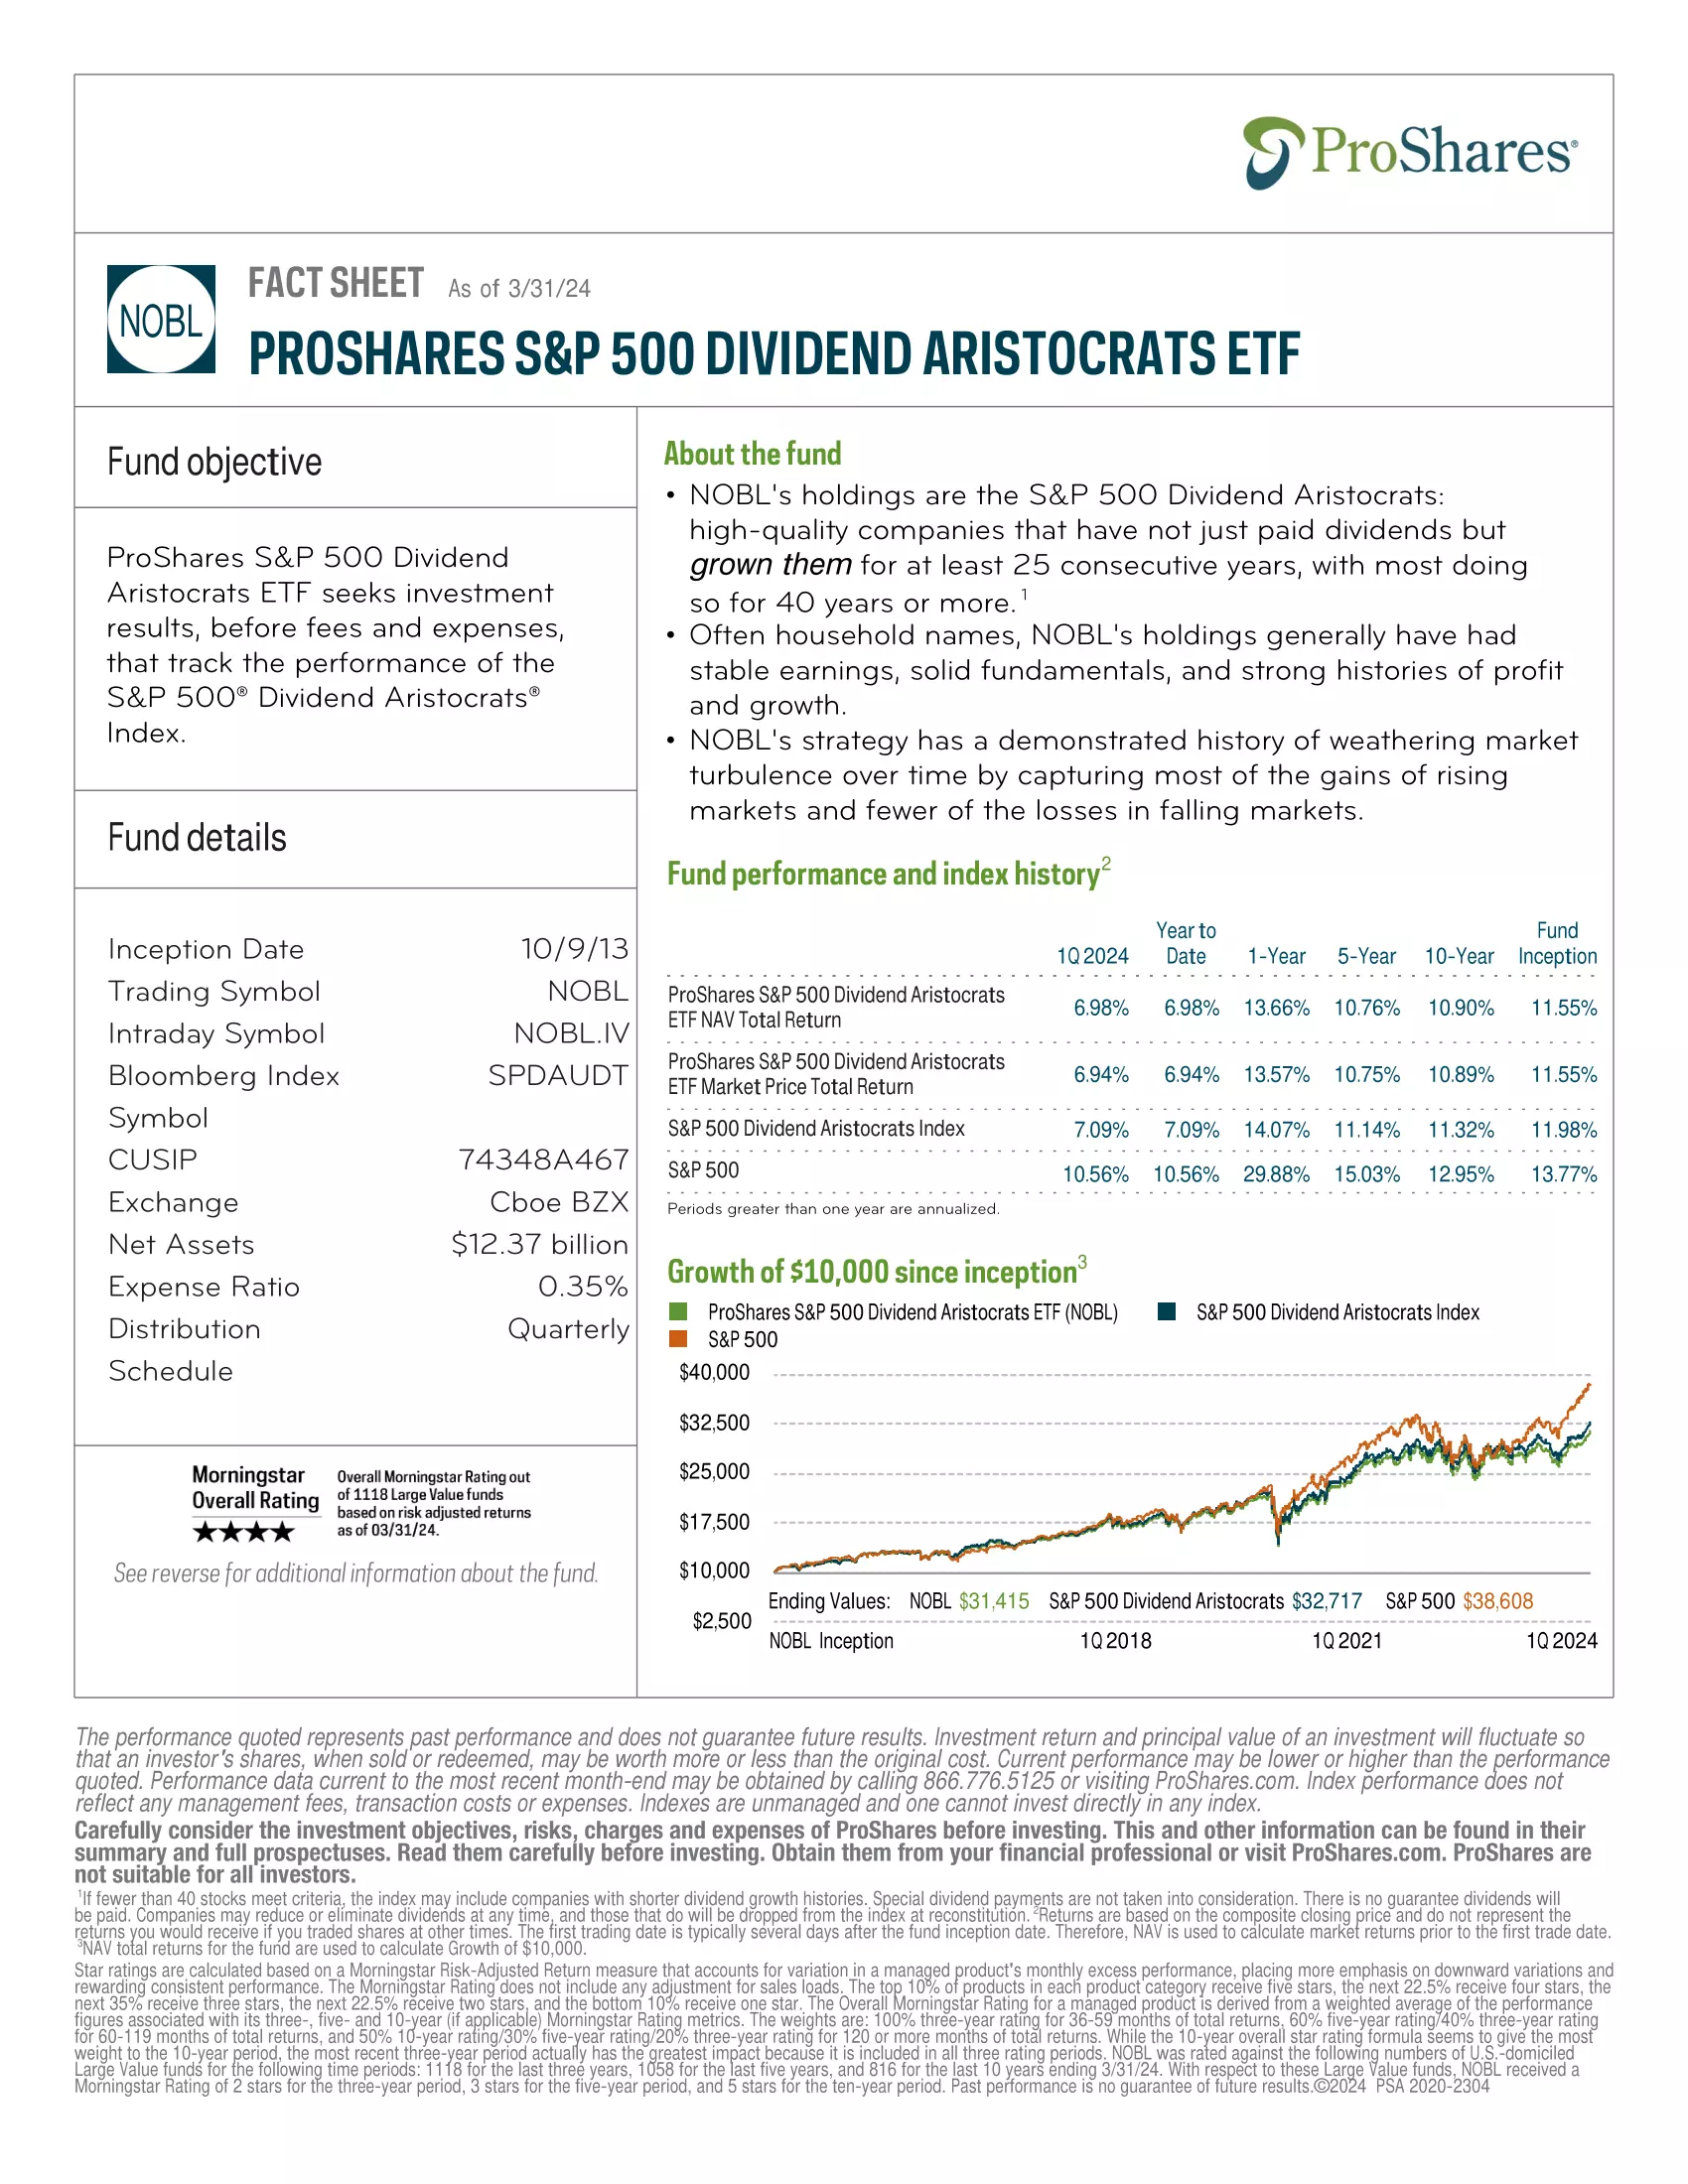
ProShares S&P 500 Dividend Aristocrats ETF seeks investment results, before fees and expenses, that track the performance of the S&P 500 Dividend Aristocrats Index.
- The only ETF focusing exclusively on the S&P 500 Dividend Aristocrats—high-quality companies that have not just paid dividends but grown them for at least 25 consecutive years, with most doing so for 40 years or more
- Often household names, NOBL’s holdings generally have had stable earnings, solid fundamentals, and strong histories of profit and growth
- NOBL strategy has a demonstrated history of weathering market turbulence over time by capturing most of the gains of rising markets and fewer of the losses in falling markets
| Manager | ETF | Inception | MER | AUM | Holdings | Beta | P/E | Yield | Distributions | 1Y | 3Y | 5Y | 10Y | 15Y |
|---|---|---|---|---|---|---|---|---|---|---|---|---|---|---|
| SPDV | 2017-11-28 | 0.29% | $62,489,748 | 53 | 0.80 | 12.94 | 3.95% | Monthly | 5.61% | 6.50% | 6.77% | N/A | N/A | |
 | LRGC | 2023-09-19 | N/A | $73,520,000 | 73 | N/A | N/A | N/A | Annually | N/A | N/A | N/A | N/A | N/A |
 | QGRO | 2018-09-10 | 0.29% | $879,726,671 | 192 | 1.11 | 32.59 | 0.39% | Quarterly | 26.43% | 8.59% | 16.45% | N/A | N/A |
| DIVO | 2016-12-14 | 0.55% | $2,905,158,096 | 32 | 0.68 | 15.74 | 4.57% | Monthly | 13.05% | 10.16% | 11.69% | N/A | N/A | |
 | AVUS | 2019-09-24 | 0.15% | $6,094,210,827 | 2308 | 1.00 | 17.04 | 1.40% | Quarterly | 14.35% | 10.52% | N/A | N/A | N/A |
| IVW | 2000-05-22 | 0.18% | $38,186,669,302 | 228 | 1.12 | 27.74 | 0.93% | Quarterly | 26.46% | 6.17% | 13.76% | 13.87% | 15.57% | |
 | BKLC | 2020-04-07 | 0.00% | $2,418,000,077 | 506 | 1.01 | 28.17 | 1.35% | Quarterly | 29.45% | 9.87% | N/A | N/A | N/A |
| CDEI | 2023-01-30 | 0.14% | $35,840,000 | 357 | N/A | 28.02 | 1.32% | Quarterly | 22.64% | N/A | N/A | N/A | N/A | |
| CGGR | 2022-02-22 | 0.39% | $4,642,000,000 | 125 | N/A | 28.64 | 0.40% | Semi-Annually | 30.39% | N/A | N/A | N/A | N/A | |
| SCHX | 2009-11-03 | 0.03% | $38,141,469,714 | 751 | 1.01 | 25.06 | 1.37% | Quarterly | 20.80% | 9.87% | 14.06% | 12.39% | N/A | |
 | ESGS | 2016-06-13 | 0.35% | $6,514,616 | 100 | 0.85 | 18.95 | 2.32% | Quarterly | 16.78% | 8.96% | 11.74% | N/A | N/A |
| JEPY | 2023-09-18 | 0.99% | $129,540,000 | 6 | N/A | N/A | N/A | Monthly | N/A | N/A | N/A | N/A | N/A | |
 | DFAC | 2021-06-14 | 0.17% | $26,400,000,000 | 2667 | 0.99 | 19.18 | 1.14% | Quarterly | 22.79% | 9.87% | 13.03% | 10.72% | 15.58% |
 | FDVV | 2016-09-12 | 0.15 | $2,520,000,000 | 123 | 0.90 | 11.85 | 3.31% | Quarterly | 17.80% | 9.96% | 11.65% | N/A | N/A |
 | FTHI | 2014-01-06 | 0.75% | $539,790,667 | 185 | 0.66 | 18.80 | 8.36% | Monthly | 21.01% | 10.61% | 6.87% | 6.72% | N/A |
 | ESG | 2016-07-13 | 0.32% | $199,340,000 | N/A | 1.02 | 24.12 | 1.09% | Quarterly | 21.31% | 10.29% | 14.54% | N/A | N/A |
| LRGE | 2017-05-22 | 0.59% | $206,650,000 | 42 | 1.15 | 46.59 | N/A | N/A | 31.53% | 6.95% | 13.37% | N/A | N/A | |
| AUSF | 2018-08-24 | 0.27% | $222,150,000 | 191 | 0.76 | 20.96 | 1.80% | Semi-Annually | 29.67% | 12.22% | 12.53% | N/A | N/A | |
 | JUST | 2018-06-07 | 0.20% | $331,530,000 | 466 | 0.99 | 24.68 | 1.34% | Quarterly | 20.12% | 10.33% | 14.08% | N/A | N/A |
| QQQ | 1999-03-10 | 0.20% | $259,270,000,000 | 101 | 1.18 | 36.18 | 0.58% | Quarterly | 32.47% | 8.62% | 18.29% | 18.10% | 19.32% | |
| JEPI | 2020-05-20 | 0.35% | $33,000,000,000 | 130 | 0.60 | 24.98 | 7.85% | Monthly | 15.02% | 10.62% | N/A | N/A | N/A | |
| JHML | 2015-09-28 | 0.29% | $878,100,000 | 770 | 0.98 | 22.63 | 1.33% | Semi-Annually | 26.16% | 7.46% | 14.30% | N/A | N/A | |
 | PAPI | 2023-10-16 | 0.29% | $ 30,010,000 | 191 | N/A | N/A | N/A | Monthly | N/A | N/A | N/A | N/A | N/A |
 | OUSA | 2015-07-14 | 0.48% | $736,478,089 | 102 | 0.79 | 24.16 | 1.78% | Quarterly | 13.26% | 10.03% | 10.50% | N/A | N/A |
| COWZ | 2016-12-16 | 0.49% | $19,893,341,895 | 103 | 0.91 | 8.47 | 1.93% | Quarterly | 19.70% | 11.45% | 15.56% | N/A | N/A | |
 | NOBL | 2013-10-09 | 0.35% | $11,760,000,000 | 67 | 0.88 | N/A | 2.05% | Quarterly | 9.55% | 8.72% | 10.14% | 10.50% | N/A |
 | PVAL | 2021-05-25 | 0.56% | $487,580,000 | 44 | N/A | 16.40 | 1.52% | Quarterly | 35.54% | 13.65% | N/A | N/A | N/A |
| DIA | 1998-01-13 | 0.16% | $34,227,230,000 | 30 | 0.87 | 23.25 | 1.74% | Monthly | 21.81% | 10.08% | 10.70% | 11.46% | 14.63% | |
| STXG | 2022-11-09 | 0.18% | $52,710,000 | 699 | N/A | 35.79 | 0.54% | Quarterly | 29.22% | N/A | N/A | N/A | N/A | |
| TEQI | 2020-08-04 | 0.54% | $144,600,000 | 112 | 0.80 | N/A | 2.12% | Quarterly | 4.15% | 10.37% | N/A | N/A | N/A | |
 | MOAT | 2012-04-24 | 0.46% | $12,040,000,000 | 55 | 1.02 | 27.48 | 0.87% | Annually | 15.75% | 11.80% | 14.46% | 12.98% | N/A |
| MGK | 2007-12-17 | 0.07% | $13,700,000,000 | 79 | 1.20 | 42.03 | 0.49% | Quarterly | 32.15% | 7.81% | 16.80% | 15.28% | 16.57% | |
| VSDA | 2017-04-18 | 0.40% | $238,560,735 | 74 | 0.89 | 21.99 | 2.03% | Monthly | 16.08% | 5.62% | 11.42% | N/A | N/A | |
 | JOET | 2020-11-17 | 0.29% | $89,927,599 | 125 | 1.04 | 19.32 | 1.30% | Quarterly | 12.38% | 7.97% | N/A | N/A | N/A |
 | DGRW | 2013-05-22 | 0.28% | $11,953,527,700 | 299 | 0.84 | 24.49 | 1.72% | Monthly | 17.16% | 9.81% | 12.83% | 12.29% | N/A |
| USSG | 2019-03-06 | 0.10% | $982,980,000 | 310 | 1.03 | 29.75 | 1.43% | Quarterly | 30.94% | 10.15% | 16.39% | N/A | N/A |