PID ETF Review
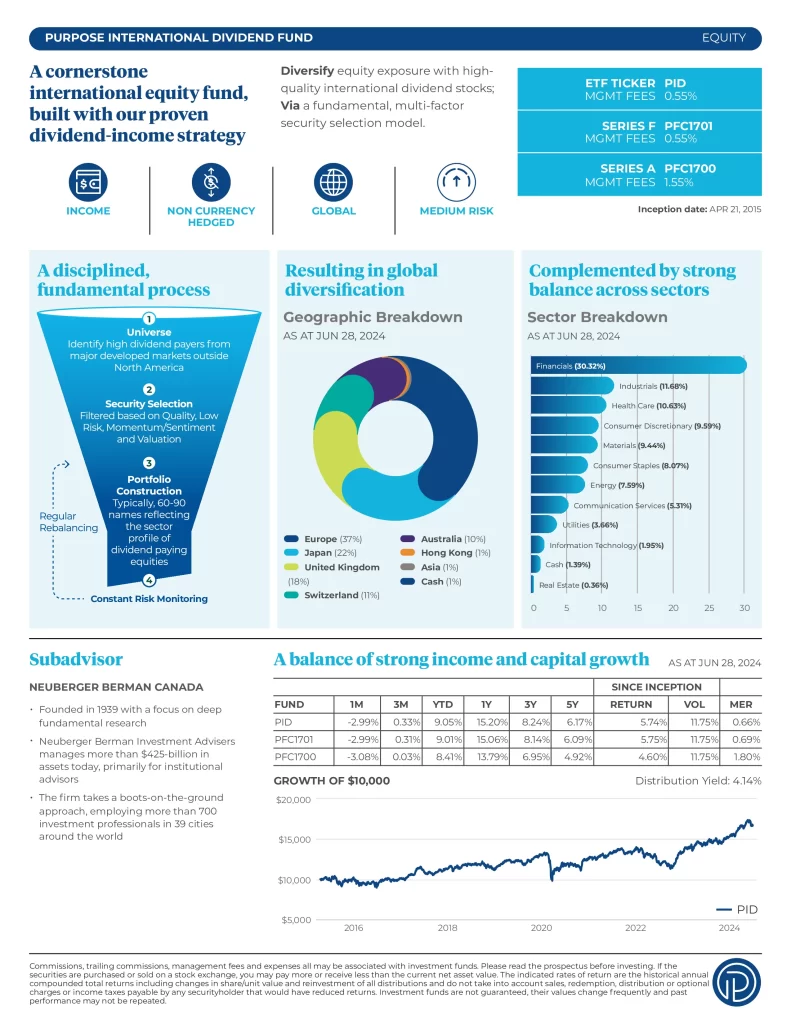
Purpose International Dividend Fund Series ETF (PID) seeks to provide unitholders with (i) long-term capital appreciation through investment in a portfolio of high-quality international dividend-paying equity securities; and (ii) monthly distributions. The ETF will invest in an equally weighted portfolio of high-quality dividend-paying equity securities of international issuers excluding the United States and Canada based on a fundamental rules-based portfolio selection strategy that is intended to create value and reduce risk over the investment period.
Top 10 PID Holdings
The top 10 investments of PID account for 27.0% of the 98 holdings. This table shows the investment names of the individual holdings that are subject to change.
| Name | Weight |
|---|---|
| Total Sa | 3.27% |
| Novartis Ag | 3.10% |
| Unilever Plc | 2.92% |
| Gsk Plc | 2.67% |
| Sanofi | 2.58% |
| Tokio Marine Holdings Inc. | 2.56% |
| Intesa Sanpaolo SpA | 2.52% |
| Axa Sa | 2.45% |
| Lafargeholcim Ltd., Class “B” | 2.44% |
| HSBC Holdings PLC | 2.39% |
Is PID a Good Investment?
Quickly compare PID to similar investments focused on international equity ETFs by risk, fees, performance, yield, volatility, and other metrics to decide which ETF will fit into your portfolio.
| Manager | ETF | Risk | Inception | MER | AUM | Holdings | Beta | P/E | Yield | Distributions | 1Y | 3Y | 5Y | 10Y | 15Y |
|---|---|---|---|---|---|---|---|---|---|---|---|---|---|---|---|
 | QIE | Medium | 2017-01-30 | 0.45% | $42,758,004 | 129 | 0.92 | 16.28 | 2.78% | Annually | 9.15% | 5.67% | 5.40% | N/A | N/A |
 | XEF | Medium | 2013-04-10 | 0.22% | $8,665,409,331 | 2577 | 1.00 | 15.38 | 2.66% | Semi-Annually | 14.82% | 5.44% | 7.10% | 6.90% | N/A |
 | ZEA | Medium | 2014-02-10 | 0.22% | $8,561,680,000 | 750 | 1.02 | N/A | 2.83% | Quarterly | 14.54% | 6.14% | 7.23% | 6.90% | N/A |
 | EDGF | Medium | 2017-07-21 | 0.96% | $20,866,298 | 25 | 0.98 | 19.43 | 5.40% | Monthly | 10.88% | 3.72% | 6.95% | N/A | N/A |
 | IQD | Medium | 2016-07-12 | 0.53% | $237,330,000 | 243 | 0.99 | 24.14 | 1.34% | Quarterly | 13.96% | 6.02% | 10.19% | N/A | N/A |
 | CIEI | Medium | 2021-03-31 | 0.19% | $38,513,349 | 881 | 0.96 | 14.95 | 2.85% | Quarterly | 10.27% | N/A | N/A | N/A | N/A |
 | DMEI | Medium | 2024-04-18 | N/A | $395,300,000 | 917 | N/A | N/A | N/A | Quarterly | N/A | N/A | N/A | N/A | N/A |
 | DXIF | Medium | 2021-03-31 | 0.83% | $12,810,000 | 20 | 1.00 | N/A | 2.44% | Annually | 13.27% | N/A | N/A | N/A | N/A |
 | FCIV | Medium | 2020-06-05 | 0.51% | $196,300,000 | 117 | 0.96 | 7.84 | 3.61% | Semi-Annually | 13.55% | 11.55% | N/A | N/A | N/A |
 | FINT | Medium | 2018-05-17 | 0.74% | $6,457,648 | 40 | 1.09 | 13.61 | 1.99% | Quarterly | 4.93% | 2.88% | 9.88% | N/A | N/A |
 | FLDM | Medium | 2017-06-05 | 0.49% | $4,340,000 | 192 | 0.86 | 9.78 | 3.37% | Semi-Annually | 12.97% | 6.99% | 7.16% | N/A | N/A |
 | HXX | Medium to High | 2016-12-06 | 0.19% | $97,090,974 | 4 | 1.16 | N/A | N/A | N/A | 14.46% | 10.50% | 10.19% | N/A | N/A |
 | GIES | Medium | 2023-11-14 | N/A | $64,747,383 | 26 | N/A | N/A | N/A | Quarterly | N/A | N/A | N/A | N/A | N/A |
 | EQE.F | Medium | 2018-09-18 | 0.34% | $1,116,183 | N/A | 1.10 | N/A | N/A | Quarterly | 12.29% | 5.85% | 7.87% | N/A | N/A |
 | QDXH | Medium | 2018-01-29 | 0.20% | $26,306,302 | 1* | 0.82 | 14.96 | 2.69% | Quarterly | 14.85% | 9.72% | 10.02% | N/A | N/A |
 | MINT | Medium | 2017-04-10 | 0.51% | $31,780,000 | 716 | 0.81 | N/A | 2.75% | Semi-Annually | 13.77 | 11.41% | 9.55% | N/A | N/A |
 | NINT | Medium | 2021-01-28 | 0.69% | N/A | 28 | 1.05 | 22.39 | 1.27% | Annually | 7.63% | N/A | N/A | N/A | N/A |
 | PID | Low to Medium | 2015-04-16 | 0.67% | $76,600,000 | 98 | 0.77 | 11.14 | 4.09% | Monthly | 12.34% | 8.03% | 5.89% | N/A | N/A |
 | RIDH | Medium | 2014-10-22 | 0.55% | $41,360,000 | 127 | 0.74 | 11.06 | 3.59% | Monthly | 15.58% | 11.16% | 8.03% | N/A | N/A |
 | SRII | Medium | 2022-01-13 | 0.26% | $32,740,000 | 509 | N/A | N/A | 1.53% | Quarterly | 20.75% | N/A | N/A | N/A | N/A |
 | THE | Medium | 2016-03-22 | 0.19% | $22,710,000 | 14 | 0.81 | N/A | 2.57% | Quarterly | 12.77% | 10.24% | 9.74% | N/A | N/A |
 | VEF | Medium | 2011-11-30 | 0.22% | $5,400,000,000 | 3985 | 0.88 | 14.19 | 2.51% | Quarterly | 11.93% | 9.25% | 9.08% | 7.37% | N/A |

