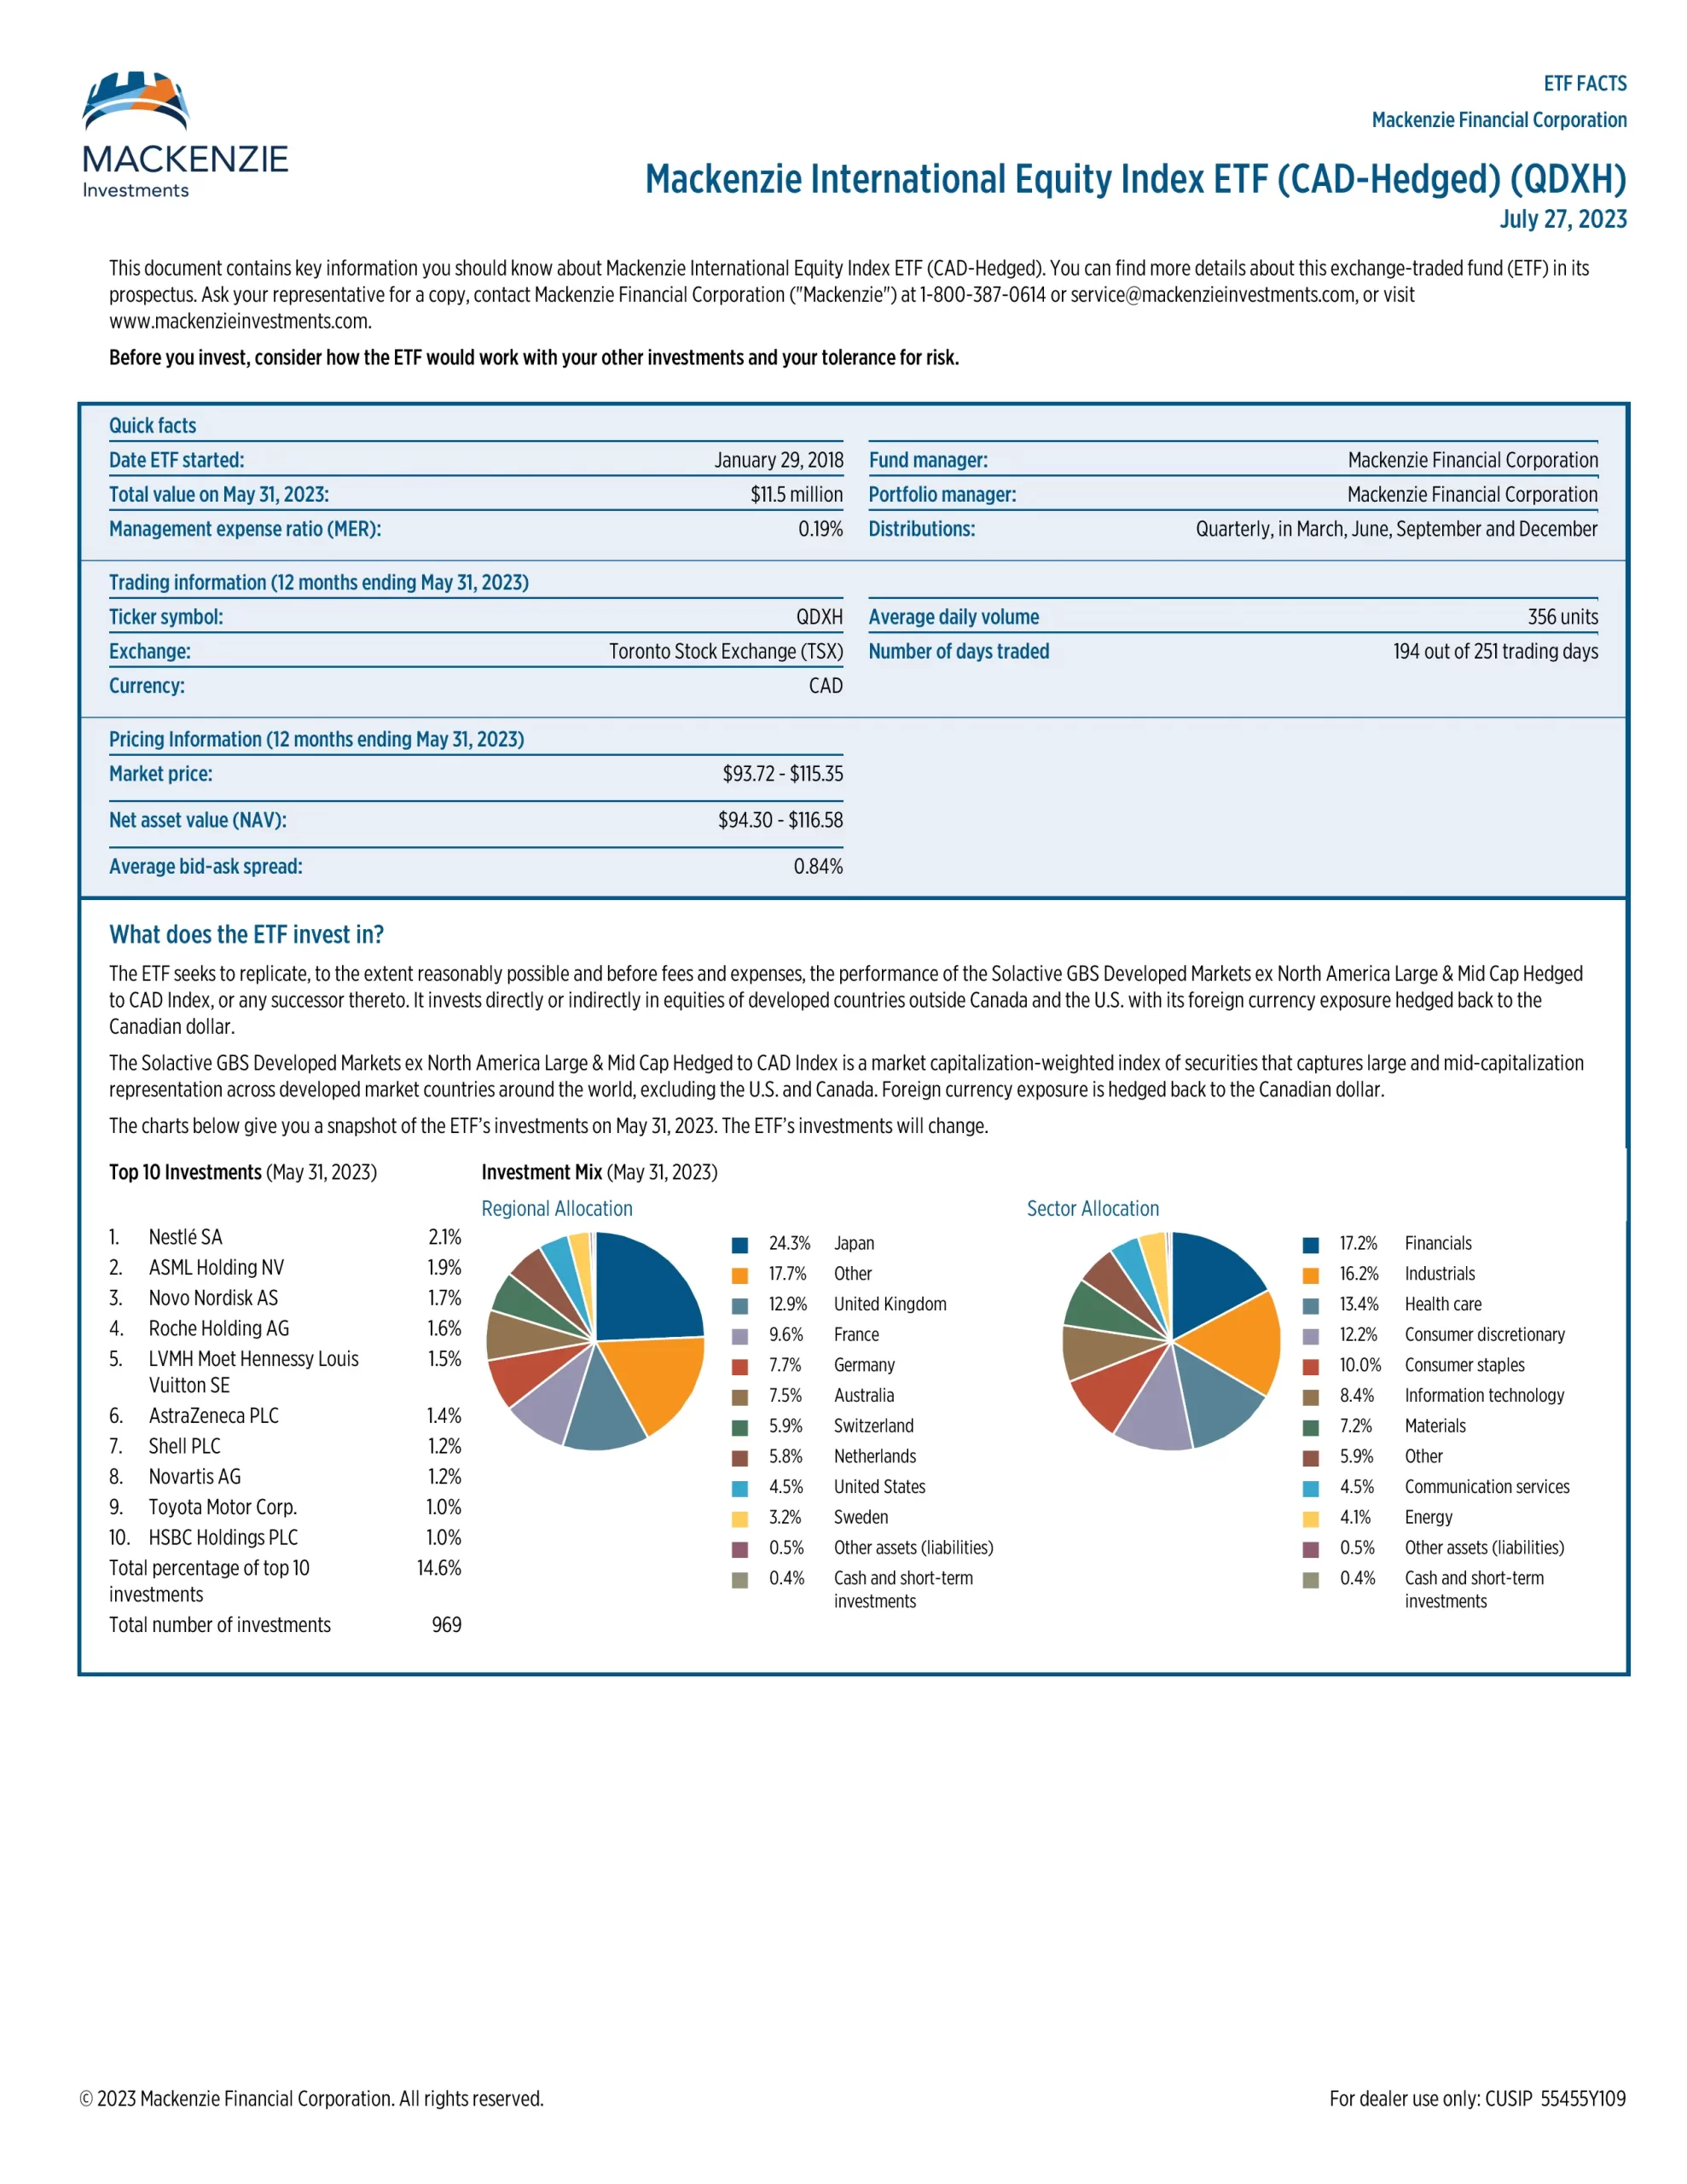
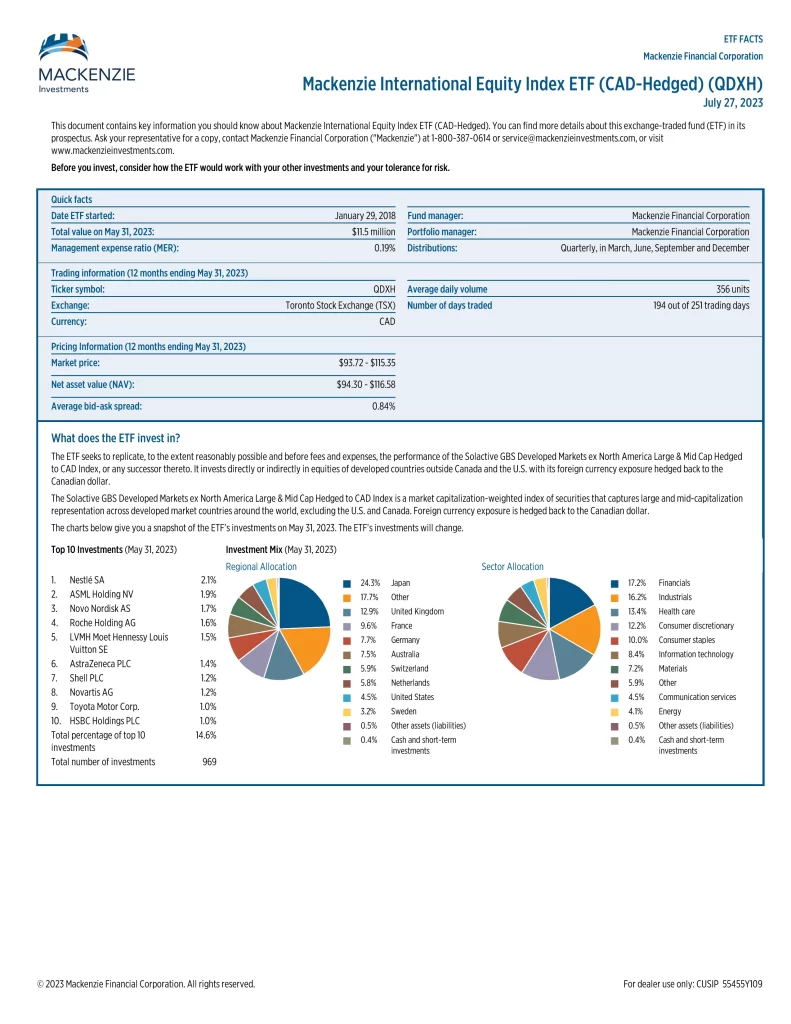
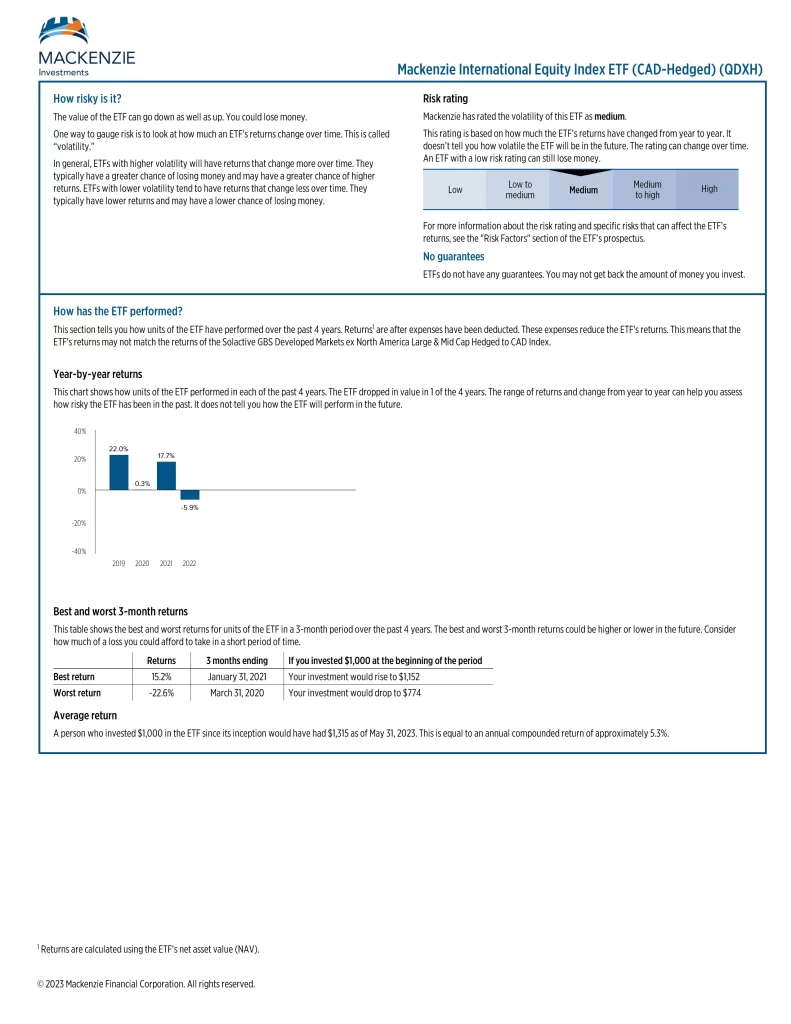
The ETF seeks to replicate, to the extent reasonably possible and before fees and expenses, the performance of the Solactive GBS Developed Markets ex North America Large & Mid Cap Hedged. to CAD Index, or any successor thereto. It invests directly or indirectly in equities of developed countries outside Canada and the U.S. with its foreign currency exposure hedged back to the Canadian dollar.
The Solactive GBS Developed Markets ex-North America Large & Mid Cap Hedged to CAD Index is a market capitalization-weighted index of securities that captures large and mid-capitalization representation across developed market countries around the world, excluding the U.S. and Canada. Foreign currency exposure is hedged back to the Canadian dollar.
| Manager | ETF | Risk | Inception | MER | AUM | Holdings | Beta | P/E | Yield | Distributions | 1Y | 3Y | 5Y | 10Y | 15Y |
|---|---|---|---|---|---|---|---|---|---|---|---|---|---|---|---|
 | QIE | Medium | 2017-01-30 | 0.45% | $42,758,004 | 129 | 0.92 | 16.28 | 2.78% | N/A | 9.15% | 5.67% | 5.40% | N/A | N/A |
 | CJP | Medium to High | 2007-02-14 | 0.72% | $37,319,307 | 281 | 0.47 | 15.31 | 1.13% | Semi-Annually | 48.67% | 22.21% | 16.17% | 11.74% | 9.71% |
 | ZEQ | Medium | 2014-02-10 | 0.45% | $904,770,000 | 127 | 0.90 | N/A | 2.47% | Quarterly | 8.18% | 6.97% | 9.73% | 9.40% | N/A |
 | EDGF | Medium | 2017-07-21 | 0.96% | $20,866,298 | 25 | 0.98 | 19.43 | 5.40% | Monthly | 10.88% | 3.72% | 6.95% | N/A | N/A |
 | VXM | Medium to High | 2014-11-13 | 0.67% | $16,410,000 | 201 | 0.66 | 7.15 | 2.91% | Quarterly | 37.53% | 16.09% | 12.48% | N/A | N/A |
 | CIEI | Medium | 2021-03-31 | 0.19% | $38,513,349 | 881 | 0.96 | 14.95 | 2.85% | Quarterly | 10.27% | N/A | N/A | N/A | N/A |
 | DXIF | Medium | 2021-03-31 | 0.83% | $12,810,000 | 20 | 1.00 | N/A | 2.44% | Annually | 13.27 | N/A | N/A | N/A | N/A |
 | FCIV | Medium | 2020-06-05 | 0.51% | $196,300,000 | 117 | 0.96 | 7.84 | 3.61% | Semi-Annually | 13.55% | 11.55% | N/A | N/A | N/A |
 | FINT | Medium | 2018-05-17 | 0.74% | $6,457,648 | 40 | 1.09 | 13.61 | 1.99% | Quarterly | 4.93% | 2.88% | 9.88% | N/A | N/A |
 | FLDM | Medium | 2017-06-05 | 0.49% | $4,340,000 | 192 | 0.86 | 9.78 | 3.37% | Semi-Annually | 12.97% | 6.99% | 7.16% | N/A | N/A |
 | HXX | Medium to High | 2016-12-06 | 0.19% | $97,090,974 | 4 | 1.16 | N/A | N/A | N/A | 14.46% | 10.50% | 10.19% | N/A | N/A |
 | GIES | Medium | 2023-11-14 | N/A | $64,747,383 | 26 | N/A | N/A | N/A | Quarterly | N/A | N/A | N/A | N/A | N/A |
 | EQE.F | Medium | 2018-09-18 | 0.34% | $1,116,183 | N/A | 1.10 | N/A | N/A | Quarterly | 12.29% | 5.85% | 7.87% | N/A | N/A |
 | QDXH | Medium | 2018-01-29 | 0.20% | $26,306,302 | 1* | 0.82 | 14.96 | 2.69% | Quarterly | 14.85% | 9.72% | 10.02% | N/A | N/A |
 | MINT | Medium | 2017-04-10 | 0.51% | $31,780,000 | 716 | 0.81 | N/A | 2.75% | Semi-Annually | 13.77 | 11.41% | 9.55% | N/A | N/A |
 | NINT | Medium | 2021-01-28 | 0.69% | N/A | 28 | 1.05 | 22.39 | 1.27% | Annually | 7.63% | N/A | N/A | N/A | N/A |
 | PID | Low to Medium | 2015-04-16 | 0.67% | $76,600,000 | 98 | 0.77 | 11.14 | 4.09% | Monthly | 12.34% | 8.03% | 5.89% | N/A | N/A |
 | RIDH | Medium | 2014-10-22 | 0.55% | $41,360,000 | 127 | 0.74 | 11.06 | 3.59% | Monthly | 15.58% | 11.16% | 8.03% | N/A | N/A |
 | SRII | Medium | 2022-01-13 | 0.26% | $32,740,000 | 509 | N/A | N/A | 1.53% | Quarterly | 20.75% | N/A | N/A | N/A | N/A |
 | THE | Medium | 2016-03-22 | 0.19% | $22,710,000 | 14 | 0.81 | N/A | 2.57% | Quarterly | 12.77% | 10.24% | 9.74% | N/A | N/A |
 | VEF | Medium | 2011-11-30 | 0.22% | $5,400,000,000 | 3985 | 0.88 | 14.19 | 2.51% | Quarterly | 11.93% | 9.25% | 9.08% | 7.37% | N/A |

