QQQM ETF Review
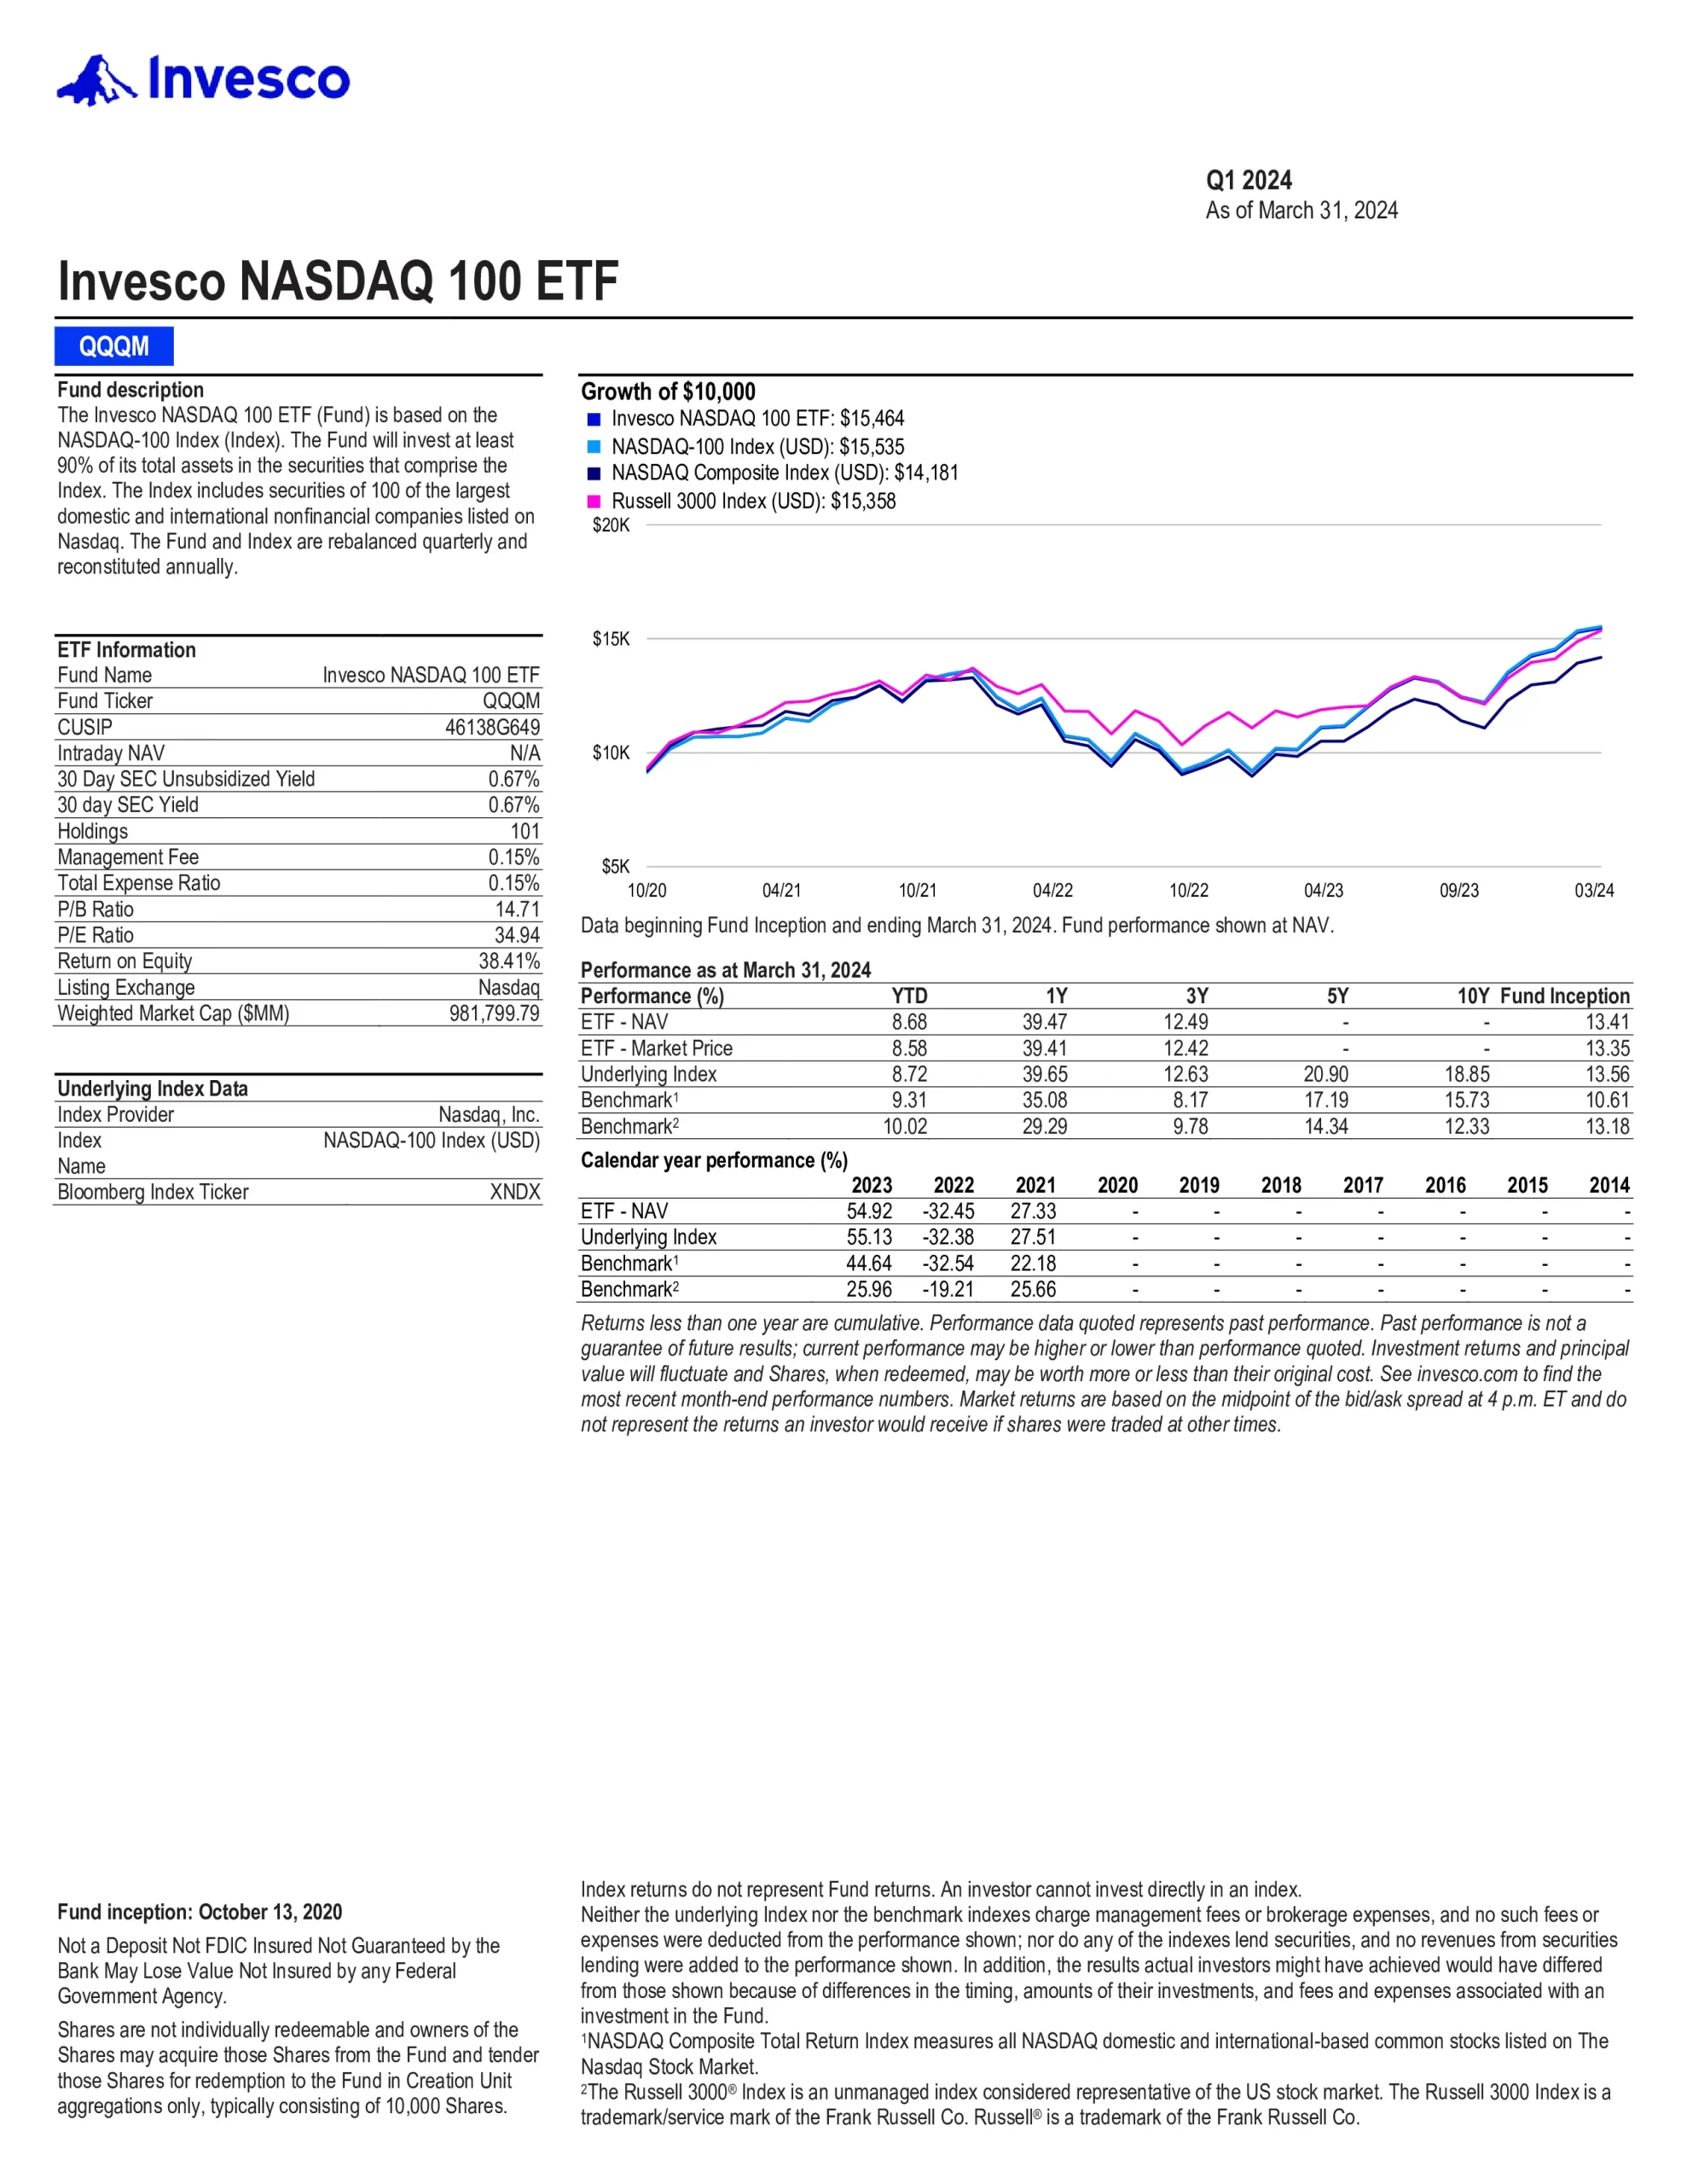
The Invesco NASDAQ 100 ETF is based on the NASDAQ-100 Index. The Fund will invest at least 90% of its total assets in the securities that comprise the Index. The Index includes securities of 100 of the largest domestic and international nonfinancial companies listed on Nasdaq. The Fund and Index are rebalanced quarterly and reconstituted annually.

Top 10 QQQM Holdings
Fund holdings are subject to change.
| Ticker | Name | Weight |
|---|---|---|
| TSLA | Tesla Inc | 4.07% |
| NVDA | NVIDIA Corp | 8.24% |
| NFLX | Netflix Inc | 2.40% |
| MSFT | Microsoft Corp | 7.68% |
| META | Meta Platforms Inc | 5.11% |
| GOOGL | Alphabet Inc | 2.41% |
| COST | Costco Wholesale Corp | 2.69% |
| AVGO | Broadcom Inc | 4.82% |
| AMZN | Amazon.com Inc | 5.37% |
| AAPL | Apple Inc | 8.84% |
Is QQQM a Good Investment?
Quickly compare this ETF to similar funds by fees, performance, yield, and other metrics to decide which investment fits your portfolio.
| ETF | Inception | MER | AUM | Holdings | Beta | P/E | Yield | Distributions | 1Y | 3Y | 5Y | 10Y | 15Y |
|---|---|---|---|---|---|---|---|---|---|---|---|---|---|
| SPDV | 2017-11-28 | 0.29% | $62,489,748 | 53 | 0.80 | 12.94 | 3.95% | Monthly | 5.61% | 6.50% | 6.77% | N/A | N/A |
| LRGC | 2023-09-19 | N/A | $73,520,000 | 73 | N/A | N/A | N/A | Annually | N/A | N/A | N/A | N/A | N/A |
| QGRO | 2018-09-10 | 0.29% | $879,726,671 | 192 | 1.11 | 32.59 | 0.39% | Quarterly | 26.43% | 8.59% | 16.45% | N/A | N/A |
| DIVO | 2016-12-14 | 0.55% | $2,905,158,096 | 32 | 0.68 | 15.74 | 4.57% | Monthly | 13.05% | 10.16% | 11.69% | N/A | N/A |
| AVUS | 2019-09-24 | 0.15% | $6,094,210,827 | 2308 | 1.00 | 17.04 | 1.40% | Quarterly | 14.35% | 10.52% | N/A | N/A | N/A |
| IWY | 2009-09-22 | 0.20% | $11,959,388,471 | 110 | 1.15 | 42.39 | 0.58% | Quarterly | 35.22% | 12.87% | 20.95% | 16.87% | N/A |
| BKLC | 2020-04-07 | 0.00% | $2,418,000,077 | 506 | 1.01 | 28.17 | 1.35% | Quarterly | 29.45% | 9.87% | N/A | N/A | N/A |
| CDEI | 2023-01-30 | 0.14% | $35,840,000 | 357 | N/A | 28.02 | 1.32% | Quarterly | 22.64% | N/A | N/A | N/A | N/A |
| CGGR | 2022-02-22 | 0.39% | $4,642,000,000 | 125 | N/A | 28.64 | 0.40% | Semi-Annually | 30.39% | N/A | N/A | N/A | N/A |
| SCHX | 2009-11-03 | 0.03% | $38,141,469,714 | 751 | 1.01 | 25.06 | 1.37% | Quarterly | 20.80% | 9.87% | 14.06% | 12.39% | N/A |
| ESGS | 2016-06-13 | 0.35% | $6,514,616 | 100 | 0.85 | 18.95 | 2.32% | Quarterly | 16.78% | 8.96% | 11.74% | N/A | N/A |
| JEPY | 2023-09-18 | 0.99% | $129,540,000 | 6 | N/A | N/A | N/A | Monthly | N/A | N/A | N/A | N/A | N/A |
| DFAC | 2021-06-14 | 0.17% | $26,400,000,000 | 2667 | 0.99 | 19.18 | 1.14% | Quarterly | 22.79% | 9.87% | 13.03% | 10.72% | 15.58% |
| FDVV | 2016-09-12 | 0.15 | $2,520,000,000 | 123 | 0.90 | 11.85 | 3.31% | Quarterly | 17.80% | 9.96% | 11.65% | N/A | N/A |
| FTHI | 2014-01-06 | 0.75% | $539,790,667 | 185 | 0.66 | 18.80 | 8.36% | Monthly | 21.01% | 10.61% | 6.87% | 6.72% | N/A |
| ESG | 2016-07-13 | 0.32% | $199,340,000 | N/A | 1.02 | 24.12 | 1.09% | Quarterly | 21.31% | 10.29% | 14.54% | N/A | N/A |
| LRGE | 2017-05-22 | 0.59% | $206,650,000 | 42 | 1.15 | 46.59 | N/A | N/A | 31.53% | 6.95% | 13.37% | N/A | N/A |
| AUSF | 2018-08-24 | 0.27% | $222,150,000 | 191 | 0.76 | 20.96 | 1.80% | Semi-Annually | 29.67% | 12.22% | 12.53% | N/A | N/A |
| JUST | 2018-06-07 | 0.20% | $331,530,000 | 466 | 0.99 | 24.68 | 1.34% | Quarterly | 20.12% | 10.33% | 14.08% | N/A | N/A |
| QQQM | 2020-10-13 | 0.15% | $28,563,800,000 | 103 | 1.19 | 39.10 | 0.64% | Quarterly | 30.95% | 11.41% | N/A | N/A | N/A |
| JEPI | 2020-05-20 | 0.35% | $33,000,000,000 | 130 | 0.60 | 24.98 | 7.85% | Monthly | 15.02% | 10.62% | N/A | N/A | N/A |
| JHML | 2015-09-28 | 0.29% | $878,100,000 | 770 | 0.98 | 22.63 | 1.33% | Semi-Annually | 26.16% | 7.46% | 14.30% | N/A | N/A |
| PAPI | 2023-10-16 | 0.29% | $ 30,010,000 | 191 | N/A | N/A | N/A | Monthly | N/A | N/A | N/A | N/A | N/A |
| NULG | 2016-12-13 | 0.26% | $1,500,000,000 | 64 | 1.21 | 44.81 | 0.39% | Annually | 33.46% | 10.24% | 19.55% | N/A | N/A |
| OUSA | 2015-07-14 | 0.48% | $736,478,089 | 102 | 0.79 | 24.16 | 1.78% | Quarterly | 13.26% | 10.03% | 10.50% | N/A | N/A |
| COWZ | 2016-12-16 | 0.49% | $19,893,341,895 | 103 | 0.91 | 8.47 | 1.93% | Quarterly | 19.70% | 11.45% | 15.56% | N/A | N/A |
| NOBL | 2013-10-09 | 0.35% | $11,760,000,000 | 67 | 0.88 | N/A | 2.05% | Quarterly | 9.55% | 8.72% | 10.14% | 10.50% | N/A |
| PVAL | 2021-05-25 | 0.56% | $487,580,000 | 44 | N/A | 16.40 | 1.52% | Quarterly | 35.54% | 13.65% | N/A | N/A | N/A |
| DIA | 1998-01-13 | 0.16% | $34,227,230,000 | 30 | 0.87 | 23.25 | 1.74% | Monthly | 21.81% | 10.08% | 10.70% | 11.46% | 14.63% |
| STXG | 2022-11-09 | 0.18% | $52,710,000 | 699 | N/A | 35.79 | 0.54% | Quarterly | 29.22% | N/A | N/A | N/A | N/A |
| TEQI | 2020-08-04 | 0.54% | $144,600,000 | 112 | 0.80 | N/A | 2.12% | Quarterly | 4.15% | 10.37% | N/A | N/A | N/A |
| MOAT | 2012-04-24 | 0.46% | $12,040,000,000 | 55 | 1.02 | 27.48 | 0.87% | Annually | 15.75% | 11.80% | 14.46% | 12.98% | N/A |
| MGK | 2007-12-17 | 0.07% | $13,700,000,000 | 79 | 1.20 | 42.03 | 0.49% | Quarterly | 32.15% | 7.81% | 16.80% | 15.28% | 16.57% |
| VSDA | 2017-04-18 | 0.40% | $238,560,735 | 74 | 0.89 | 21.99 | 2.03% | Monthly | 16.08% | 5.62% | 11.42% | N/A | N/A |
| JOET | 2020-11-17 | 0.29% | $89,927,599 | 125 | 1.04 | 19.32 | 1.30% | Quarterly | 12.38% | 7.97% | N/A | N/A | N/A |
| DGRW | 2013-05-22 | 0.28% | $11,953,527,700 | 299 | 0.84 | 24.49 | 1.72% | Monthly | 17.16% | 9.81% | 12.83% | 12.29% | N/A |
| USSG | 2019-03-06 | 0.10% | $982,980,000 | 310 | 1.03 | 29.75 | 1.43% | Quarterly | 30.94% | 10.15% | 16.39% | N/A | N/A |
Conclusion
There are risks involved with investing in ETFs, including possible loss of money. Ordinary brokerage commissions apply. The Fund’s return may not match the return of the Underlying Index. Growth stocks tend to be more sensitive to changes in their earnings and can be more volatile. Investments focused on a particular sector, such as healthcare, are subject to greater risk, and are more greatly impacted by market volatility than more diversified investments. A value style of investing is subject to the risk that the valuations never improve or that the returns will trail other styles of investing or the overall stock markets. Beta is a measure of risk representing how a security is expected to respond to general market movements.