

Global X NASDAQ 100 Covered Call ETF (QYLD) seeks to generate income through covered call writing, which historically produces higher yields in periods of volatility.
An Exchange Traded Fund (ETF) is a collection of hundreds or thousands of stocks or bonds in a single fund that trades on major stock exchanges. ETFs combine the diversification of mutual funds with lower investment minimum and real-time pricing.
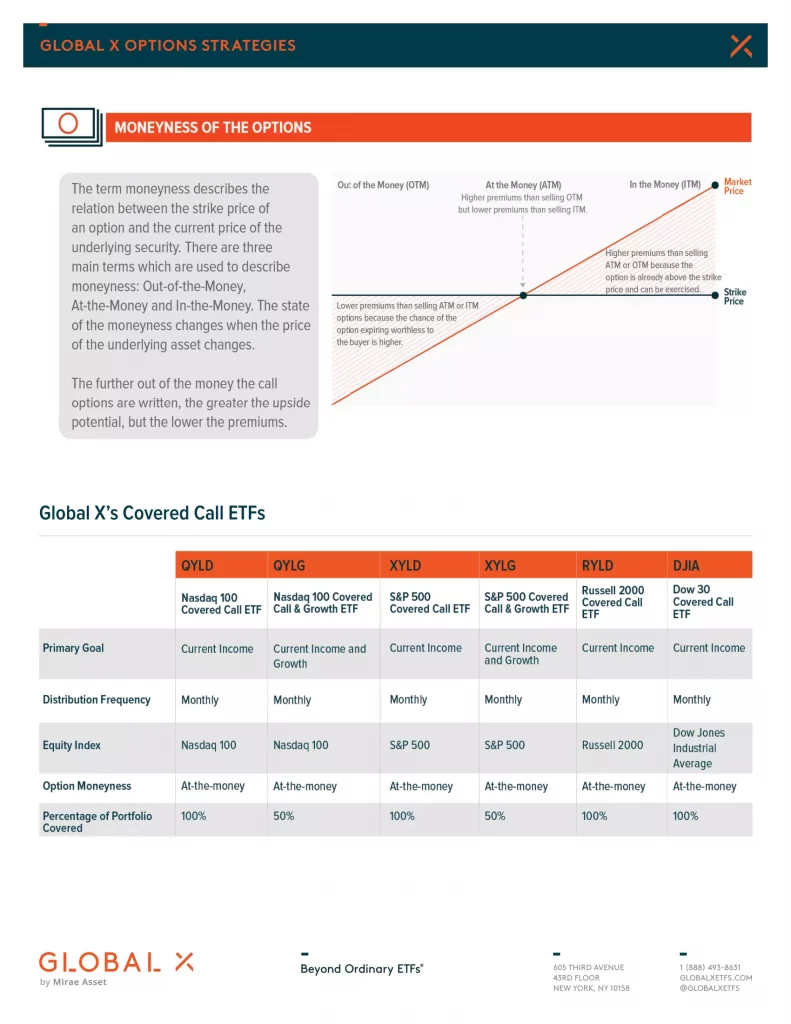
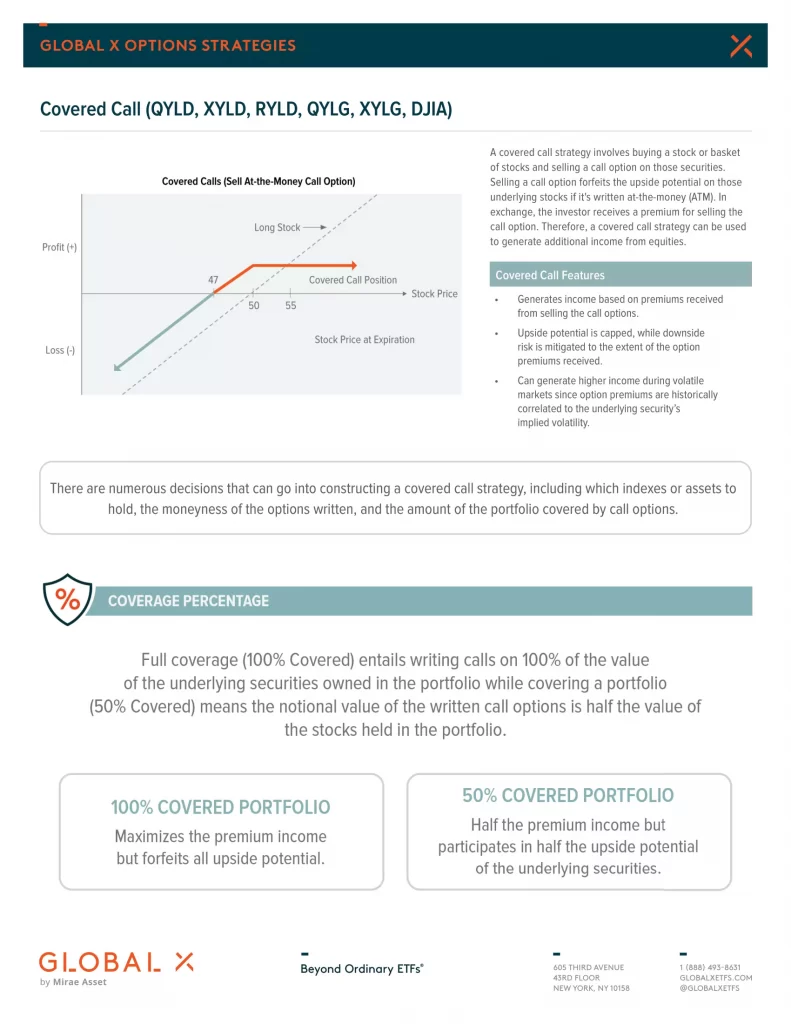
A covered call ETF writes call options on the stocks held within the fund to help reduce investment risk. This also allows investors to take advantage of upside potential in the same way an individual investor trading stock options would do. This is a great strategy during market volatility while still bringing in monthly income from option writing and regular dividends.
 |  |  |  |  |  |
|---|---|---|---|---|---|
| Advice | InvestCAN | InvestRESP | InvestUSA | RetireCAN | RetireMGN |
| $500.00 CAD $400.00 USD | $99.99 CAD | $79.99 USD | $99.99 CAD | $12.99 CAD $9.99 USD |
 Rishi Vikram2024-06-03Nic is client focused advisor . Honest advice is rare in today’s world But Nic gave good ,Simple and to the point information.
 Sunny2024-02-29Nic's vast knowledge in financial investments is exceptional. Highly recommended.
 Peter Vigna2024-01-27Nic is the best source for financial education on social media best etf recommendations.
 519 Painting2023-05-01Nick was a tremendous help with our financial planning for our new company!
 Shiella A2022-06-30Nic is professional, intuitive, personable and passionate about his role. We are so gald to have Nic as our financial advisor; our portfolios are well managed and we have been happy with the outcomes over the years. Nic always goes out of his way to help us. We had a bad experience with our Canada life mortgage broker, his lack of support and responsiveness almost cost our family a great opportunity so we had to move on. We honestly wish Nic was able to handle our mortgage needs as well. This will ensure that all our service needs will be well managed. Thank you Nic for everything you do!
 Jake Thuss2022-06-25Nic is the best financial advisor I have come across in London, Ontario. He knowledgeably helped us with our investments, life insurance and a mortgage. He is a great financial planner to deal with!
 John Vella2021-06-10This was my first experience with a financial planner. Nic took the time to explain everything to me. He is very patient and thorough. We talked about my goals and plans for retirement. We also talked about my comfort level when it comes to the the ups and downs of investing. I felt very comfortable with Nic. He is down to earth and very knowledgeable. I would highly recommend Nic to anyone needing a financial planner. I feel much more comfortable with my investment plan because of Nic and look forward to working with him for all my investment needs.
 Jimal Isovski2021-05-11My experience dealing with Nic was flawless. He was extremely informative, supportive and organized when dealing with all my questions and investments. He truly looks out for his clients and does whatever it takes to go above and beyond for their success.
 Karen Campbell2021-05-10Nic always has your best interest in mind. Very knowledgeable, respectful of your time and very keen. Trust-worthy too.
QYLD ETF Review
QYLD has made monthly distributions 8 years running. QYLD writes call options on the Nasdaq-100 Index, saving investors the time and potential expense of doing so individually.
| Price | $16.68 |
| 52-Week Range | $15.00 – $21.09 |
| Dividend Yield | 12.76% |
| Ex-Dividend | 2023-02-21 |
| Dividend Date | 2023-03-01 |
- Dividend Date – the date that a company announces it is paying a dividend
- Ex-Dividend: Ex-Dividend Date – the dividend will be received if bought at least one day before this date
- N/A: Not Applicable or Not Available
- Price: Stock Price – current value to buyers and sellers
- Dividend Yield – the percentage of a corporation’s stock price that it pays in dividends annually
- 52-Week Range – the lowest and highest price at which a stock has traded during the previous 52-weeks
QYLD Top 5 Holdings
- AAPL: Apple Inc.
- AMZN: Amazon.com, Inc.
- GOOG: Alphabet Inc.
- GOOGL: Alphabet Inc Class A
- MSFT: Microsoft Corporation
QYLD Top 5 Sectors
- Technology: 49.87%
- Communication: 17.02%
- Discretionary: 15.59%
- Health Care: 6.40%
- Staples: 5.86%
QYLD vs JEPI vs. QQQ vs. HYLD vs. XYLD vs. RYLD vs. JEPQ vs QYLG vs QQQX vs SCHD vs NUSI
Here is a table comparing similar ETFs as of December 31, 2022. Here is a table comparing Global X NASDAQ 100 Covered Call ETF (QYLD) to JPMorgan Nasdaq Equity Premium Income ETF (JEPQ) and Nationwide Nasdaq-100 Risk-Managed Income ETF (NUSI) as of December 31, 2022
QYLD Pros
- High dividend yield
- Monthly distributions
QYLD Cons
- You could lose money
| ETF | QYLD | JEPI | XYLD | RYLD | JEPQ | QYLG | QQQX | NUSI |
| Manager | Global X | JPMorgan | Global X | Global X | JPMorgan | Global X | Nuveen | Nationwide |
| AUM | $6,790,000,000 | $21,020,000,000 | $2,340,000,000 | $1,450,000,000 | $1,060,000,000 | $68,510,000 | $949,717,669 | $456,059,151 |
| MER | 0.60% | 0.35% | 0.60% | 0.60% | 0.35% | 0.60% | 0.92% | 0.68% |
| Yield | 13.58% | 11.15% | 13.52% | 13.65% | 16.62% | 6.33% | 8.40% | 7.90% |
| Distributions | Monthly | Monthly | Monthly | Monthly | Monthly | Monthly | Quarterly | Monthly |
| 1M | 7.10% | 1.73% | 4.14% | 3.87% | 6.01% | 8.87% | 9.33% | 2.59% |
| 3M | 7.73% | 4.92% | 4.68% | 1.92% | 4.69% | 6.94% | 3.38% | 0.35% |
| YTD | 7.10% | 1.73% | 4.14% | 3.87% | 6.01% | 8.87% | 9.33% | 2.59% |
| 1Y | -8.32% | 1.70% | -6.03% | -4.13% | N/A | -13.67% | -15.91% | -20.86% |
| 3Y | 1.27% | N/A | 3.13% | 4.42% | N/A | N/A | 5.38% | -2.23% |
| 5Y | 3.94% | N/A | 3.94% | N/A | N/A | N/A | 5.00% | N/A |
| 10Y | N/A | N/A | N/A | N/A | N/A | N/A | 10.84% | N/A |
- AUM – Assets Under Management
- Distributions – Dividend Distributions
- ETF – Exchange Traded Fund
- Manager – Fund or Portfolio Manager
- MER – Management Expense Ratio
- N/A – Not Applicable or Not Available
- Risk – Risk Rating (Volatility)
- Yield – Dividend or Distribution Yield
- YTD – Year to Date
- 1MO – 1-Month Performance
- 3MO – 3-Month Performance
- 1YR – 1-Year Performance
- 3YR – 3-Year Performance
- 5YR – 5-Year Performance
- 10YR – 10-Year Performance