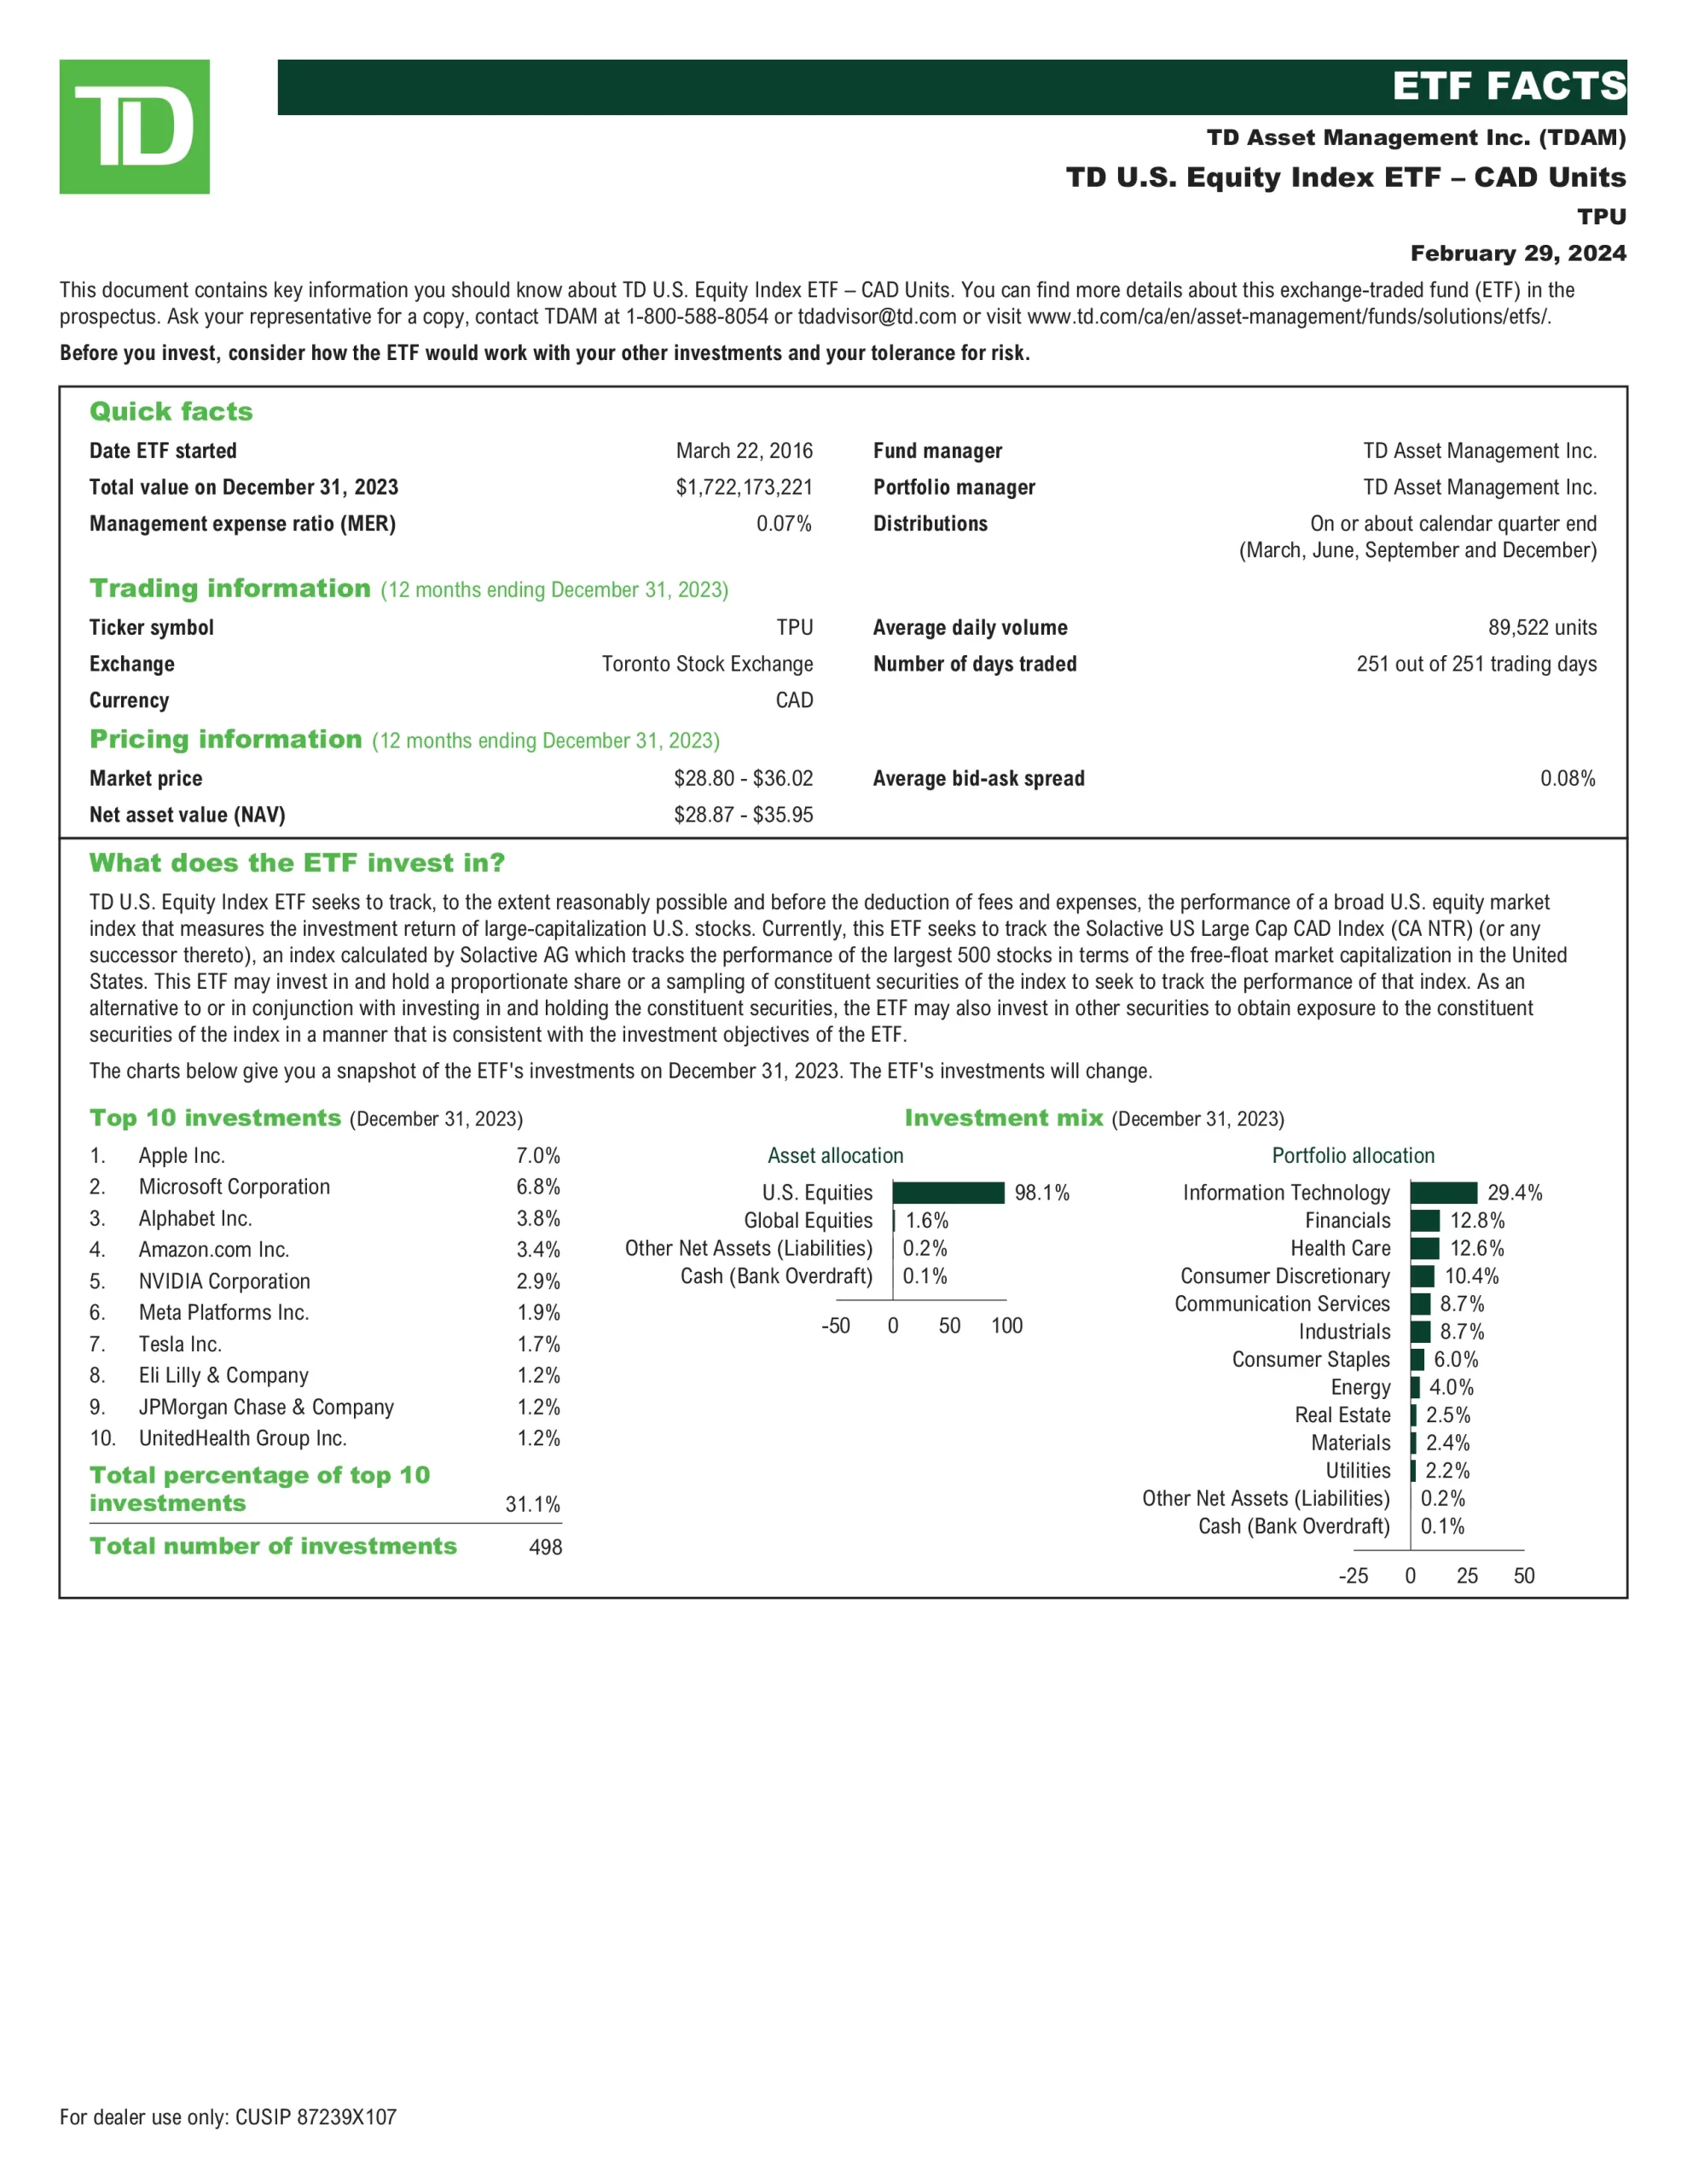
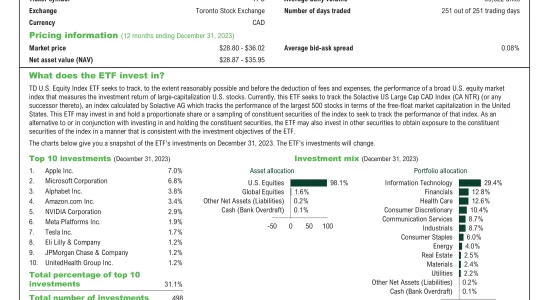
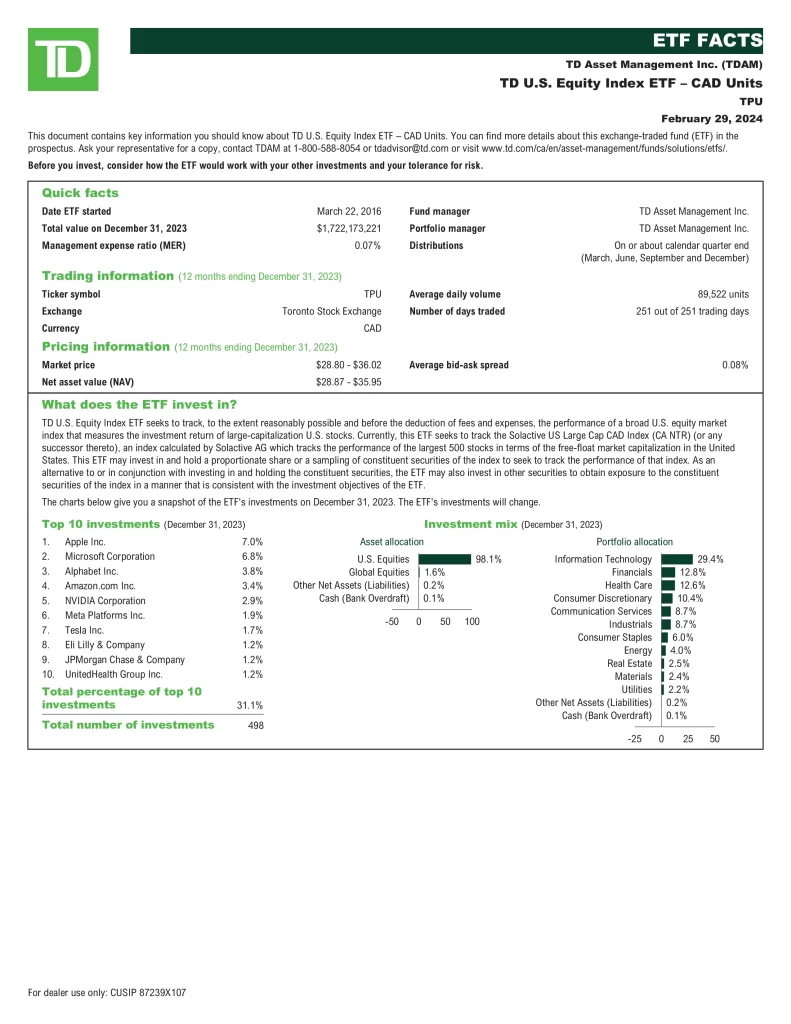
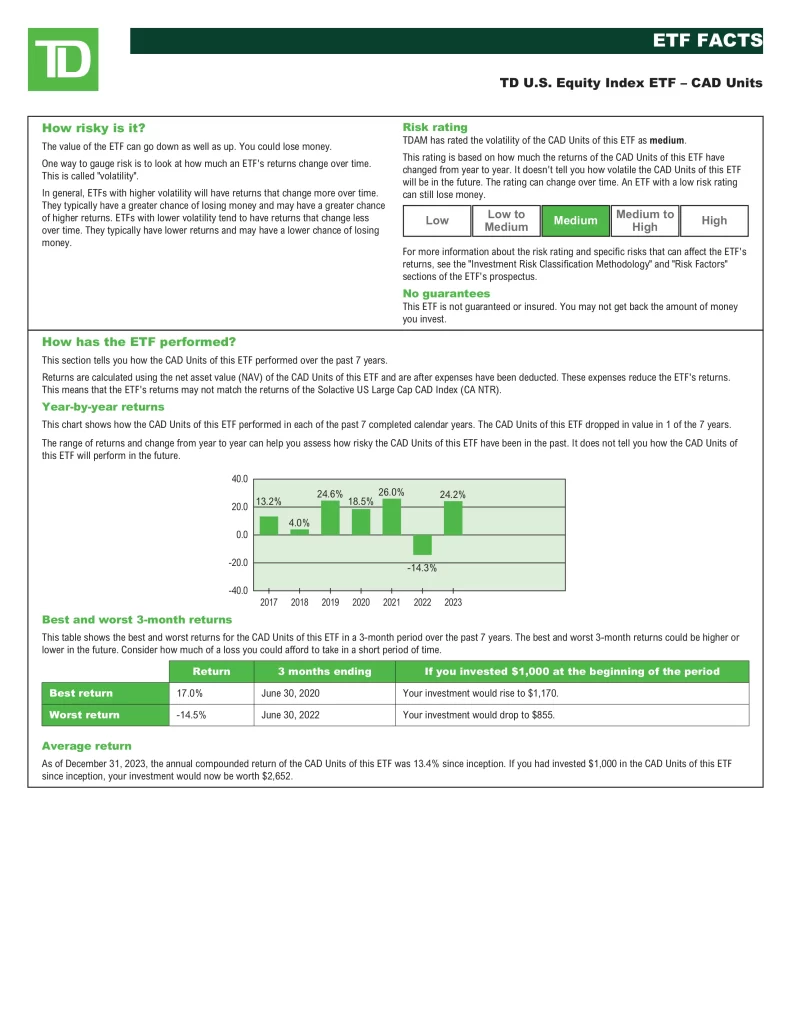
TD U.S. Equity Index ETF (TPU) seeks to track, to the extent reasonably possible and before the deduction of fees and expenses, the performance of a broad U.S. equity market index that measures the investment return of large-capitalization U.S. stocks. Currently, this ETF seeks to track the Solactive US Large Cap CAD Index (CA NTR) (or any successor thereto), an index calculated by Solactive AG which tracks the performance of the largest 500 stocks in terms of the free-float market capitalization in the United States. This ETF may invest in and hold a proportionate share or a sampling of constituent securities of the index to seek to track the performance of that index. As an alternative to or in conjunction with investing in and holding the constituent securities, the ETF may also invest in other securities to obtain exposure to the constituent securities of the index in a manner that is consistent with the investment objectives of the ETF.
| Manager | ETF | Risk | Inception | MER | AUM | Holdings | Beta | P/E | Yield | Distributions | 1Y | 3Y | 5Y | 10Y | 15Y |
|---|---|---|---|---|---|---|---|---|---|---|---|---|---|---|---|
 | QUS | Medium | 2017-01-30 | 0.45% | $126,642,949 | 143 | 0.92 | 22.84 | 0.99% | Annually | 18.02% | 9.55% | 11.91% | N/A | N/A |
 | CLU.C | Medium | 2009-04-07 | 0.72% | 83,056,857 | 1005 | 0.80 | 16.93 | 1.26% | Quarterly | 25.53% | 11.22% | 13.46% | 12.11% | 14.27% |
 | ZUQ | Medium | 2014-11-05 | 0.34% | $773,470,000 | 128 | 1.03 | N/A | 0.81% | Quarterly | 31.95% | 13.77% | 15.26% | N/A | N/A |
 | KNGU | Medium to High | 2024-05-30 | N/A | N/A | 50 | N/A | N/A | N/A | Monthly | N/A | N/A | N/A | N/A | N/A |
 | DGR.B | Medium | 2016-07-12 | 0.38% | $189,050,000 | 301 | 0.74 | 24.29 | 1.37% | Quarterly | 17.08% | 13.79% | 14.42% | N/A | N/A |
 | CUEI | Medium | 2021-03-31 | 0.06% | $284,043,239 | N/A | 0.96 | 25.07 | 1.35% | Quarterly | 22.13% | N/A | N/A | N/A | N/A |
 | DXU | Medium | 2017-01-20 | 0.80% | $128,280,000 | 27 | 0.82 | N/A | N/A | Annually | 17.37% | 5.42% | 11.65% | N/A | N/A |
 | ESPX.B | Medium | 2023-01-09 | 0.69% | $95,756,000 | 505 | N/A | N/A | 8.25% | Monthly | 19.37% | N/A | N/A | N/A | N/A |
 | FCUV | Medium | 2020-06-05 | 0.39% | $466,600,000 | 93 | 0.91 | 12.34 | 1.27% | Quarterly | 30.65% | 20.45% | N/A | N/A | N/A |
 | FLUS | Medium | 2017-05-31 | 0.29% | $63,580,000 | 210 | 0.92 | 19.93 | 1.19% | Quarterly | 22.80% | 13.21% | 12.85% | N/A | N/A |
 | HXQ | Medium to High | 2016-04-19 | 0.28% | $566,043,835 | 103 | N/A | N/A | N/A | N/A | 32.24% | 8.41% | 18.02% | N/A | N/A |
 | GIQU.B | Medium | 2020-11-08 | 0.71% | $10,041,120 | 39 | 1.20 | 32.22 | 0.18% | Quarterly | 33.19% | 7.65% | N/A | N/A | N/A |
 | SMAX | Low to Medium | 2023-10-25 | N/A | $316,600,000 | 25 | N/A | N/A | N/A | Monthly | N/A | N/A | N/A | N/A | N/A |
 | QQC | Medium to High | 2021-05-27 | 0.20% | $771,883,536 | 103 | N/A | 41.29 | 0.53% | Quarterly | 30.69% | 15.77% | N/A | N/A | N/A |
 | QUU | Medium | 2020-09-30 | 0.07% | $2,759,704,642 | 499 | 0.97 | 25.32 | 1.17% | Quarterly | 23.00% | 11.66% | 14.82% | N/A | N/A |
 | MULC.B | Medium | 2017-04-17 | 0.36% | $64,470,000 | 747 | 0.92 | N/A | 0.98% | Semi-Annually | 16.62% | 11.07% | 13.17% | N/A | N/A |
 | NUSA | Medium | 2021-01-28 | 0.63% | $43,300,000 | 27 | 0.94 | 32.46 | 0.39% | Quarterly | 23.79% | 14.42% | N/A | N/A | N/A |
 | RUD | Medium | 2014-01-09 | 0.43% | $511,270,000 | 84 | 0.93 | 15.08 | 1.70% | Monthly | 19.23% | 14.27% | 13.60% | 13.23% | N/A |
 | SRIU | Medium | 2022-01-13 | 0.19% | $94,780,000 | 264 | N/A | N/A | 0.82% | Quarterly | 33.22% | N/A | N/A | N/A | N/A |
 | TPU | Medium | 2016-03-22 | 0.07% | $1,983,250,000 | 498 | 0.97 | N/A | 1.18% | Quarterly | 25.29% | 11.24% | 13.47% | N/A | N/A |
 | VFV | Medium | 2012-11-02 | 0.09% | $13,260,000,000 | 504 | 0.95 | 25.26 | 1.20% | Quarterly | 24.22% | 11.83% | 13.42% | 14.58% | N/A |

