


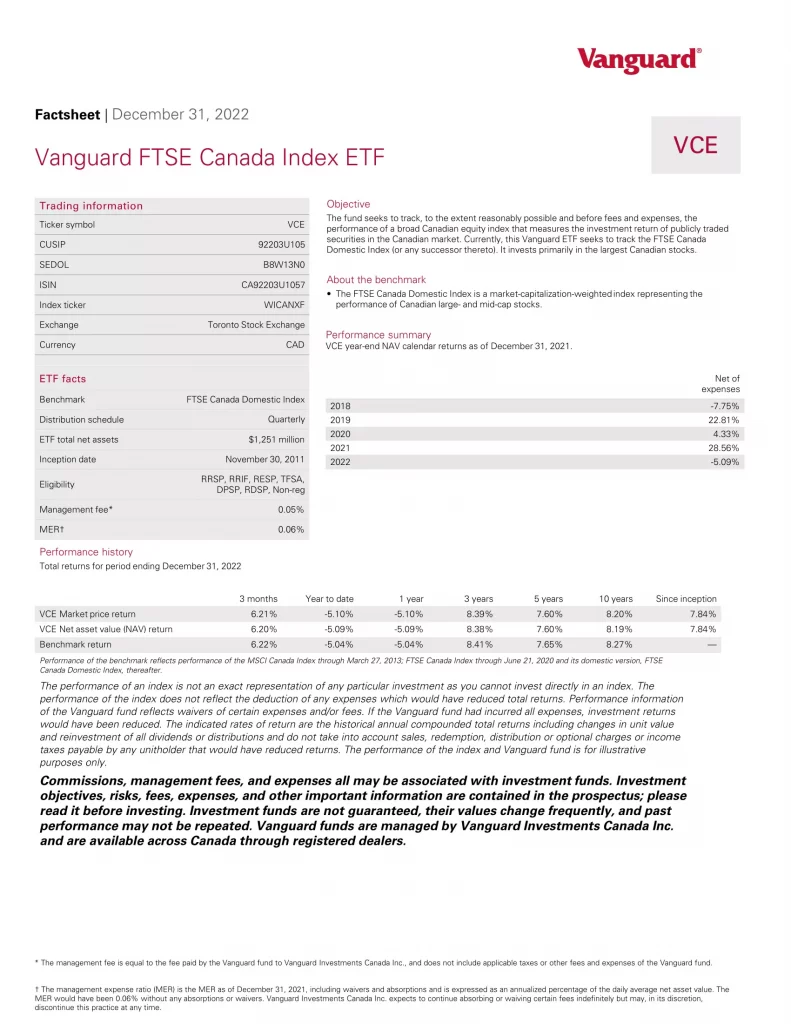
The Vanguard FTSE Canada Index ETF (VCE.TO) seeks to track, to the extent reasonably possible the performance of a broad Canadian equity index that measures the investment return of publicly traded securities in the Canadian market.
An Exchange Traded Fund (ETF) is a collection of hundreds or thousands of stocks or bonds in a single fund that trades on major stock exchanges. ETFs combine the diversification of mutual funds with lower investment minimum and real-time pricing.
VCE ETF Review
Currently, this Vanguard ETF seeks to track the FTSE Canada Domestic Index (or any successor thereto). It invests primarily in the largest Canadian stocks.
| Price | $45.11 |
| 52-Week Range | $39.01 – $48.45 |
| Dividend Yield | 3.06% |
| Ex-Dividend | Dec 29, 2022 |
| Dividend Date | Jan 09, 2023 |
- Dividend Date – the date that a company announces it is paying a dividend
- Ex-Dividend: Ex-Dividend Date – the dividend will be received if bought at least one day before this date
- N/A: Not Applicable or Not Available
- Price: Stock Price – current value to buyers and sellers
- Dividend Yield – the percentage of a corporation’s stock price that it pays in dividends annually
- 52-Week Range – the lowest and highest price at which a stock has traded during the previous 52-weeks
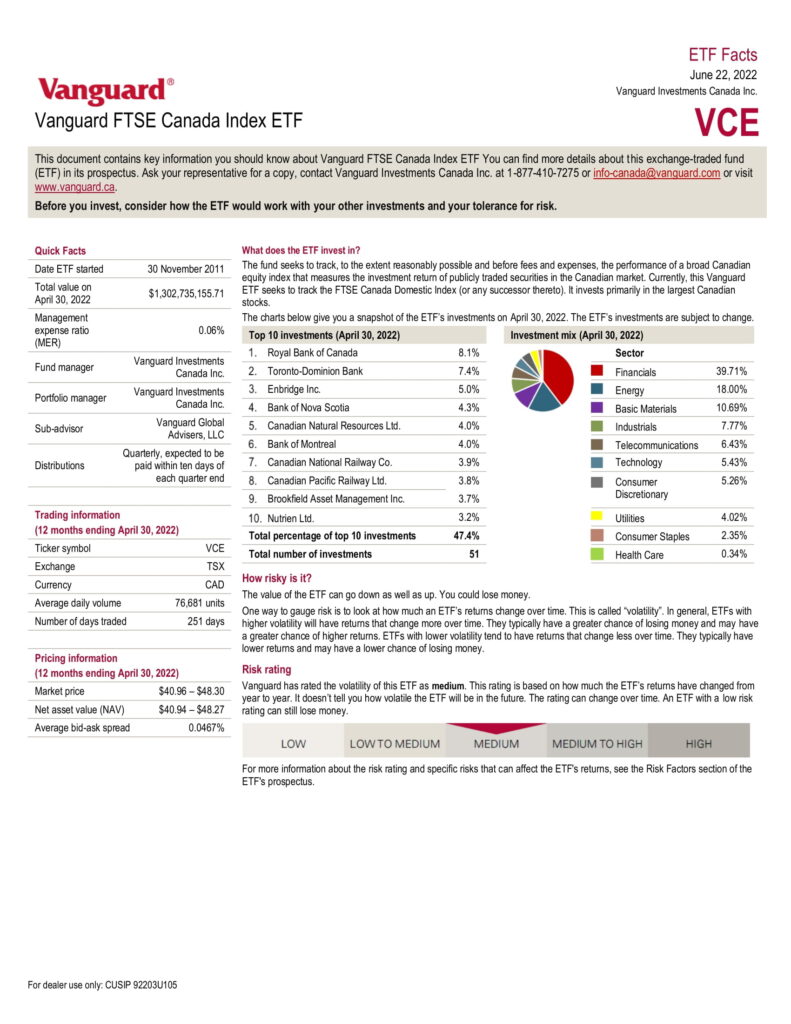
VCE Top 5 Holdings
- BNS.TO: Bank of Nova Scotia
- CNQ.TO: Canadian Natural Resources Ltd.
- ENB.TO: Enbridge Inc.
- RY.TO: Royal Bank of Canada
- TD.TO: Toronto-Dominion Bank
VCE Top 5 Sectors
- Financials: 39.7%
- Energy: 18.4%
- Materials: 9.7%
- Industrials: 9.0%
- Consumer Discretionary: 5.8%
What is the Best Canadian Equity ETF in Canada?
- VCE.TO: Vanguard FTSE Canada Index ETF
- VCN.TO: Vanguard FTSE Canada All Cap Index ETF
- VDY.TO: Vanguard FTSE Canadian High Dividend Yield Index ETF
- XIC.TO: iShares Core S&P/TSX Capped Composite Index ETF
- XIU.TO: iShares S&P/TSX 60 Index ETF
Here is a table comparing VCE to similar Canadian equity ETFs as of January 31, 2023.
| ETF | VCE | VCN | XIU | VDY | XIC |
| Manager | Vanguard | Vanguard | BlackRock | Vanguard | BlackRock |
| Inception | 2011-11-30 | 2013-08-02 | 1999-09-28 | 2012-11-02 | 2001-02-16 |
| AUM | $1,239,000,000 | $5,230,000,000 | $10,906,551,876 | $1,913,000,000 | $9,489,426,143 |
| Holdings | 51 | 182 | 60 | 47 | 236 |
| MER | 0.06% | 0.05% | 0.18% | 0.22 | 0.06% |
| Risk | Medium | Medium | Medium | Medium | Medium |
| Yield | 3.29% | 3.16% | 2.84% | 4.42% | 2.92% |
| Distributions | Quarterly | Quarterly | Quarterly | Monthly | Quarterly |
| 1M | 7.20% | 7.49% | 7.33% | 7.13 | 7.38% |
| 3M | 7.45% | 7.86% | 7.21% | 6.05% | 7.77% |
| YTD | 7.20% | 7.49% | 7.33% | 7.13% | 7.38% |
| 1Y | 1.54% | 1.51% | 0.72% | 0.96% | 1.51% |
| 3Y | 10.20% | 9.54% | 9.93% | 12.21% | 9.49% |
| 5Y | 9.42% | 8.46% | 9.08% | 9.72% | 8.70% |
| 10Y | 8.70% | N/A | 8.72% | 9.35% | 8.22% |
| P/E | 12.0 | 11.8 | 14.68 | 10.3 | 13.52 |
| P/B | 1.9 | 1.8 | 2.05 | 1.6 | 1.97 |
| Beta | 0.93 | 0.99 | 0.93 | 0.88 | 0.98 |
- AUM – Assets Under Management
- Beta – the measure of the volatility of a stock compared to the market
- Distributions – Dividend Distributions
- ETF – Exchange Traded Fund
- Holdings: Number of Holdings – the total number of different holdings of a fund
- Inception: Inception Date – the date of the first subscription for units of the fund
- Manager – Fund or Portfolio Manager
- MER – Management Expense Ratio
- N/A – Not Applicable or Not Available
- P/B: Price-to-Book – this ratio measures the market’s valuation of a company relative to its book value
- P/E: Price-to-Earnings – this ratio relates a corporation’s share price to its earnings per share
- Risk – Risk Rating (Volatility)
- Yield – Dividend or Distribution Yield
- YTD – Year to Date
- 1MO – 1-Month Performance
- 3MO – 3-Month Performance
- 1YR – 1-Year Performance
- 3YR – 3-Year Performance
- 5YR – 5-Year Performance
- 10YR – 10-Year Performance