VCN ETF Review
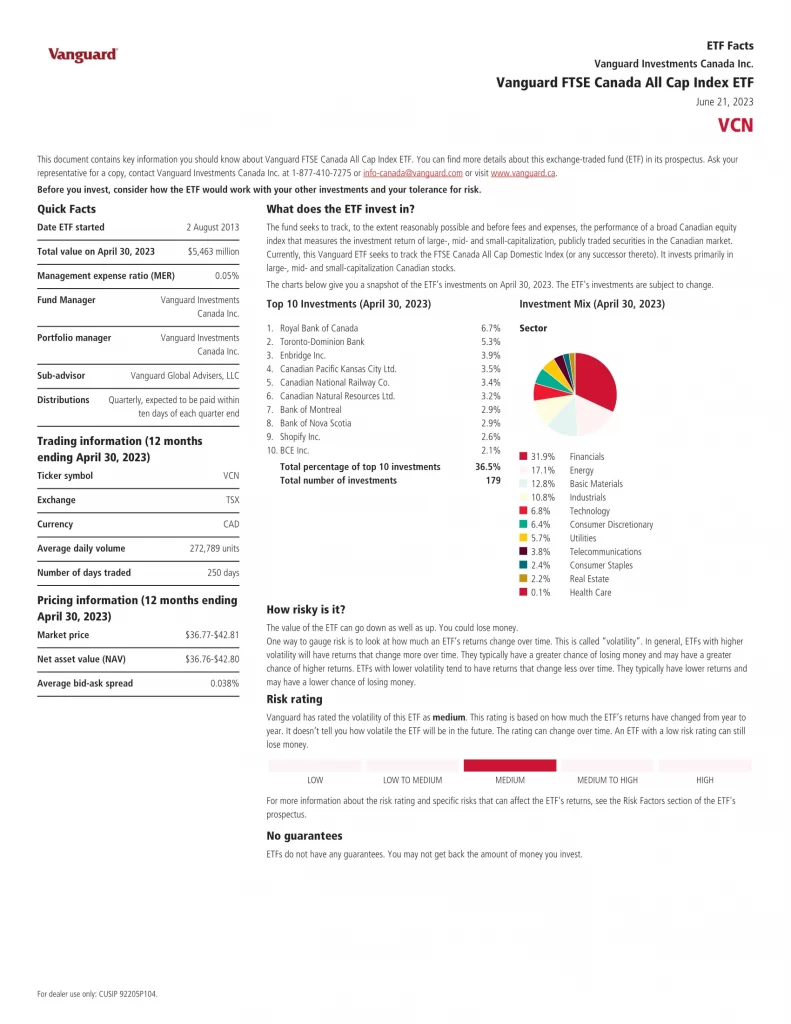
Vanguard FTSE Canada All Cap Index ETF (VCN) seeks to track, to the extent reasonably possible and before fees and expenses, the performance of a broad Canadian equity index that measures the investment return of large-, mid- and small-capitalization, publicly traded securities in the Canadian market. Currently, this Vanguard ETF seeks to track the FTSE Canada All Cap Domestic Index. It invests primarily in large-, mid- and small-capitalization Canadian stocks.
- Uses efficient, cost-effective index management techniques
Top 10 VCN Holdings
The top 10 investments of VCN account for 36.8% of the 173 holdings. This table shows the names of the individual holdings that are subject to change.
| Ticker | Name | Weight |
|---|---|---|
| RY | Royal Bank of Canada | 6.81% |
| TD | The Toronto-Dominion Bank | 4.41% |
| CNQ | Canadian Natural Resources Ltd | 3.65% |
| ENB | Enbridge Inc | 3.43% |
| CP | Canadian Pacific Kansas City Ltd | 3.28% |
| CNR | Canadian National Railway Co | 3.23% |
| SHOP | Shopify Inc | 3.03% |
| BN | Brookfield Corp | 2.90% |
| BMO | Bank of Montreal | 2.86% |
| BNS | The Bank of Nova Scotia | 2.54% |
Is VCN a Good Investment?
Quickly compare VCN to similar investments focused on Canadian equity ETFs by risk, fees, performance, yield, volatility, and other metrics to decide which ETF fits in your portfolio.
| Manager | ETF | Risk | Inception | MER | AUM | Holdings | Beta | P/E | Yield | Distributions | 1Y | 3Y | 5Y | 10Y | 15Y |
|---|---|---|---|---|---|---|---|---|---|---|---|---|---|---|---|
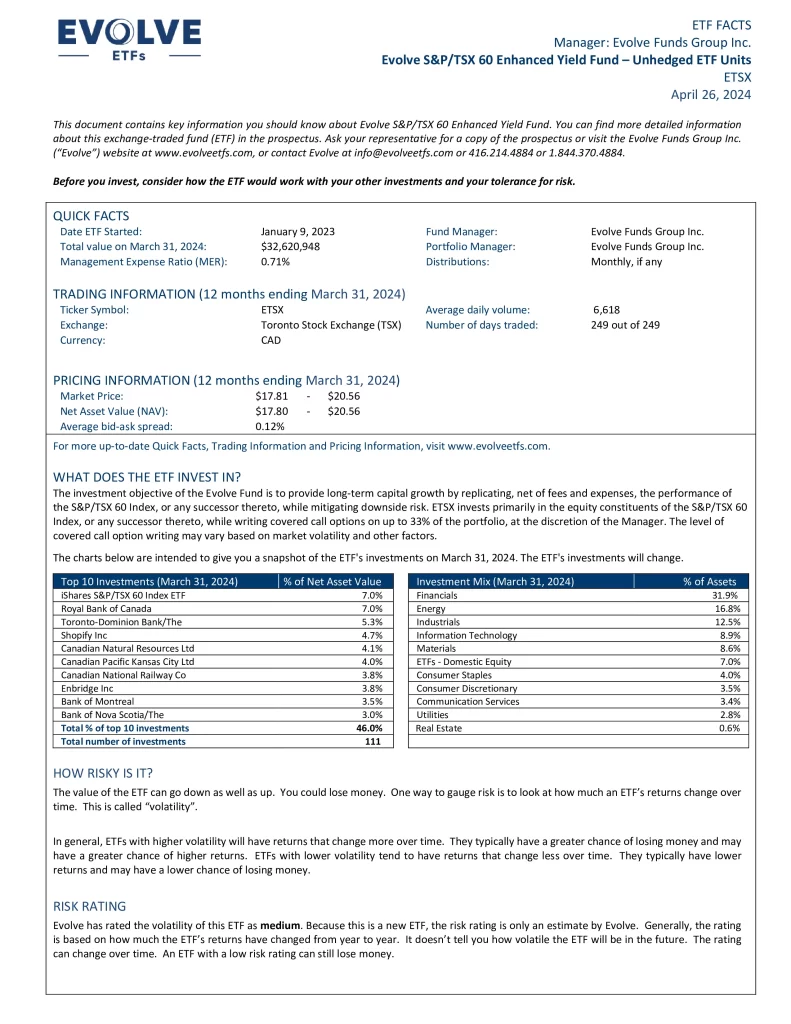
 | XIC | Medium | 2001-02-16 | 0.06% | $12,748,173,743 | 227 | 1.00 | 13.40 | 2.82% | Quarterly | 12.06% | 5.92% | 9.26% | 6.93% | 8.18% |
 | ZCN | Medium | 2009-05-29 | 0.06% | $8,224,580,000 | 228 | 1.00 | N/A | 3.15% | Quarterly | 12.04% | 5.92% | 9.26% | 6.93% | 7.71% |
 | KNGC | Medium to High | 2024-05-30 | N/A | N/A | N/A | N/A | N/A | N/A | Monthly | N/A | N/A | N/A | N/A | N/A |
 | FXM | Medium to High | 2012-02-13 | 0.65% | $305,610,000 | 31 | 0.86 | 9.47 | 2.96% | Quarterly | 10.45 | 7.04% | 11.60% | 6.31% | N/A |
 | CCEI | Medium | 2021-03-31 | 0.05% | $311,119,756 | 222 | N/A | 12.66 | 3.22% | Quarterly | 6.46% | N/A | N/A | N/A | N/A |
 | DRFC | Medium | 2018-09-27 | 0.47% | $227,310,000 | 77 | 0.91 | 13.24 | 2.38% | Quarterly | 14.21% | 10.43% | 9.91% | N/A | N/A |
 | DXC | Low to Medium | 2017-01-20 | 0.72% | $243,160,000 | 40 | 0.84 | N/A | 2.55% | Monthly | 6.05% | 8.27% | 9.90% | N/A | N/A |
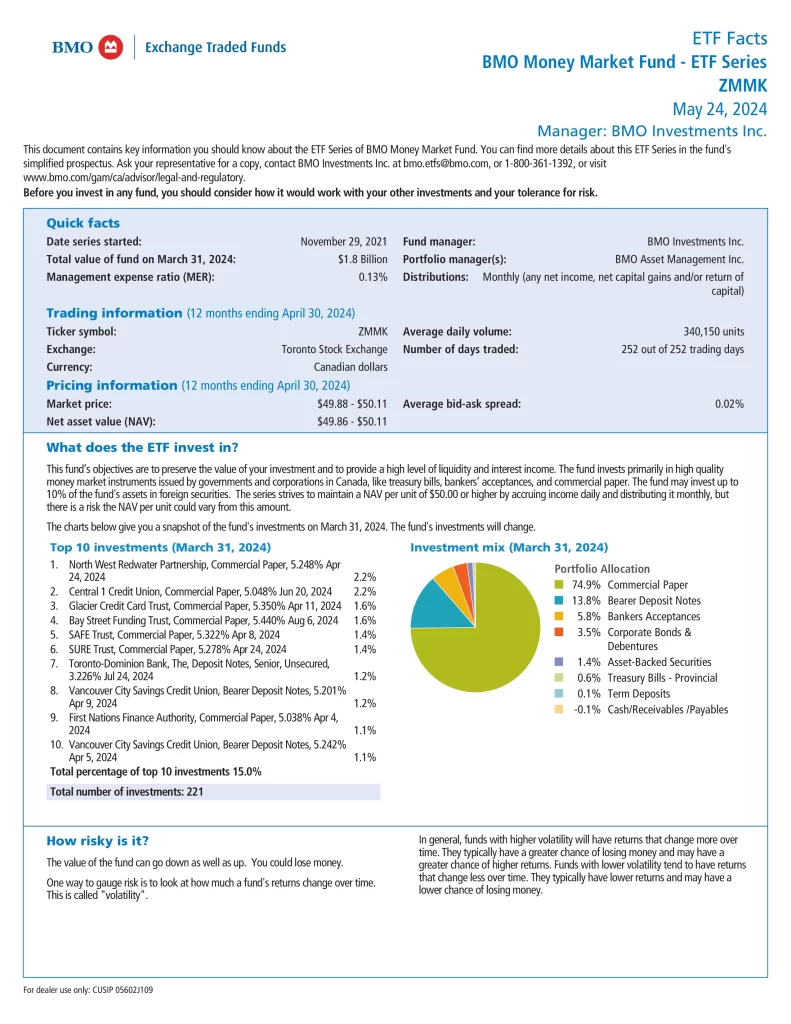
 | ETSX | Medium | 2023-01-09 | 0.71% | $29,614,000 | 95 | N/A | N/A | 9.91% | Monthly | 4.01% | N/A | N/A | N/A | N/A |
 | FCCV | Medium | 2020-06-05 | 0.39% | $139,700,000 | 66 | 1.11 | 7.06 | 3.08% | Quarterly | 4.77% | 9.60% | N/A | N/A | N/A |
 | FST | Medium | 2001-11-30 | 0.67% | $69,965,022 | 26 | 0.94 | 11.56 | 1.60% | Quarterly | 18.01% | 11.11% | 10.05% | 7.91% | 8.31% |
 | FLCD | Medium | 2019-02-13 | 0.06% | $198,070,000 | 172 | 0.99 | 12.77 | 3.20% | Quarterly | 6.05% | 9.70% | N/A | N/A | N/A |
 | HXT | Medium | 2010-09-13 | 0.04% | $3,745,125,989 | 60 | 1.01 | N/A | N/A | N/A | 11.09% | 5.90% | 9.34% | 7.47% | N/A |
 | GCSC | Medium | 2021-03-31 | 0.67% | $22,325,359 | 38 | 0.88 | 16.57 | 1.64% | Quarterly | 14.39% | 6.95% | N/A | N/A | N/A |
 | HLIF | Medium | 2022-06-08 | 0.79% | $107,270,000 | 30 | N/A | N/A | 8.00% | Monthly | 0.24% | N/A | N/A | N/A | N/A |
 | PXC | Medium | 2012-01-26 | 0.49% | $174,577,110 | 91 | 0.96 | 12.67 | 3.52% | Quarterly | 8.93% | 10.68% | 9.62% | 7.38% | N/A |
 | QCN | Medium | 2018-01-24 | 0.04% | $1,357,187,206 | 279 | 0.99 | 12.58 | 3.34% | Quarterly | 4.73% | 10.06% | 9.64% | N/A | N/A |
 | MCLC | Medium | 2017-04-10 | 0.40% | $321,170,000 | 82 | 0.96 | N/A | 2.75% | Semi-Annually | 10.12% | 10.33% | 9.30% | N/A | N/A |
 | NSCE | Medium | 2020-01-23 | 0.69% | $1,645,300,000 | 34 | 0.73 | 20.43 | 1.11% | Quarterly | 11.28% | 9.86% | N/A | N/A | N/A |
 | RCD | Medium | 2014-01-09 | 0.42% | $140,520,000 | 59 | 0.93 | 13.24 | 3.98% | Monthly | 7.74% | 8.41% | 8.63% | 5.84% | N/A |
 | SITC | Medium | 2020-11-03 | 0.06% | $71,560,000 | 57 | 0.99 | 12.87 | 2.86% | Quarterly | 12.20% | 6.37% | N/A | N/A | N/A |
 | TTP | Medium | 2016-03-22 | 0.05% | $1,620,910,000 | 279 | 0.99 | N/A | 2.89% | Quarterly | 4.74% | 10.04% | 9.63% | N/A | N/A |
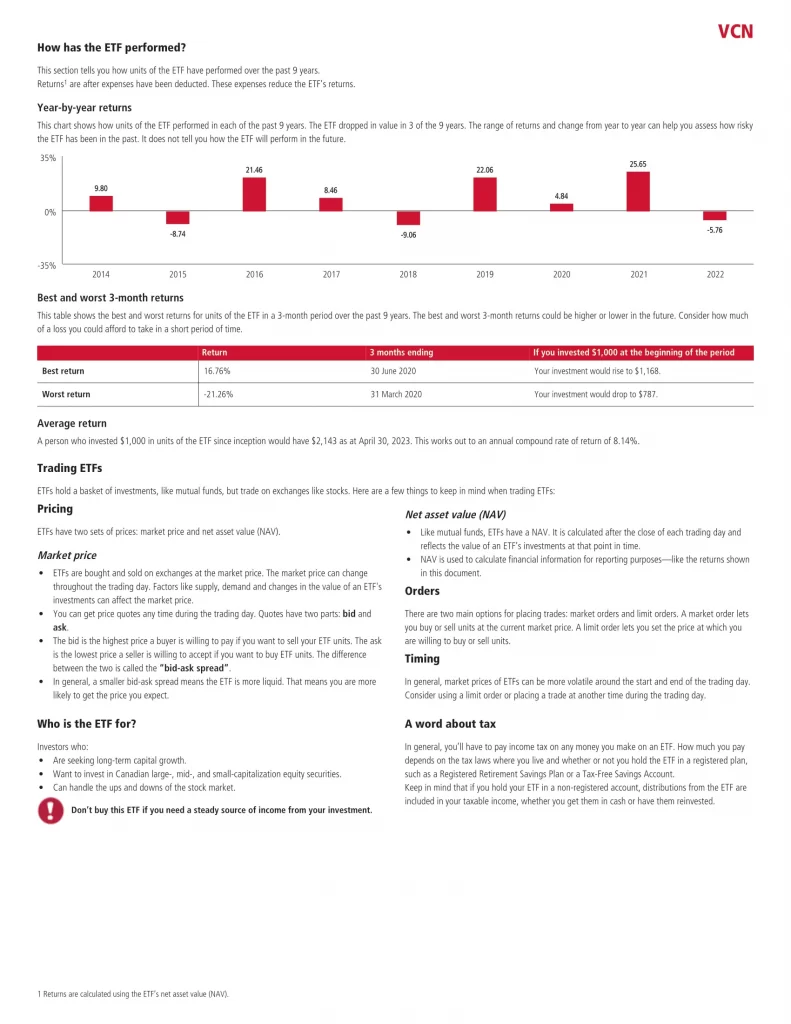
 | VCN | Medium | 2013-08-02 | 0.05% | $6,730,000,000 | 173 | 0.99 | 13.46 | 2.97% | Quarterly | 12.37% | 6.20% | 9.31% | 6.73% | N/A |


