
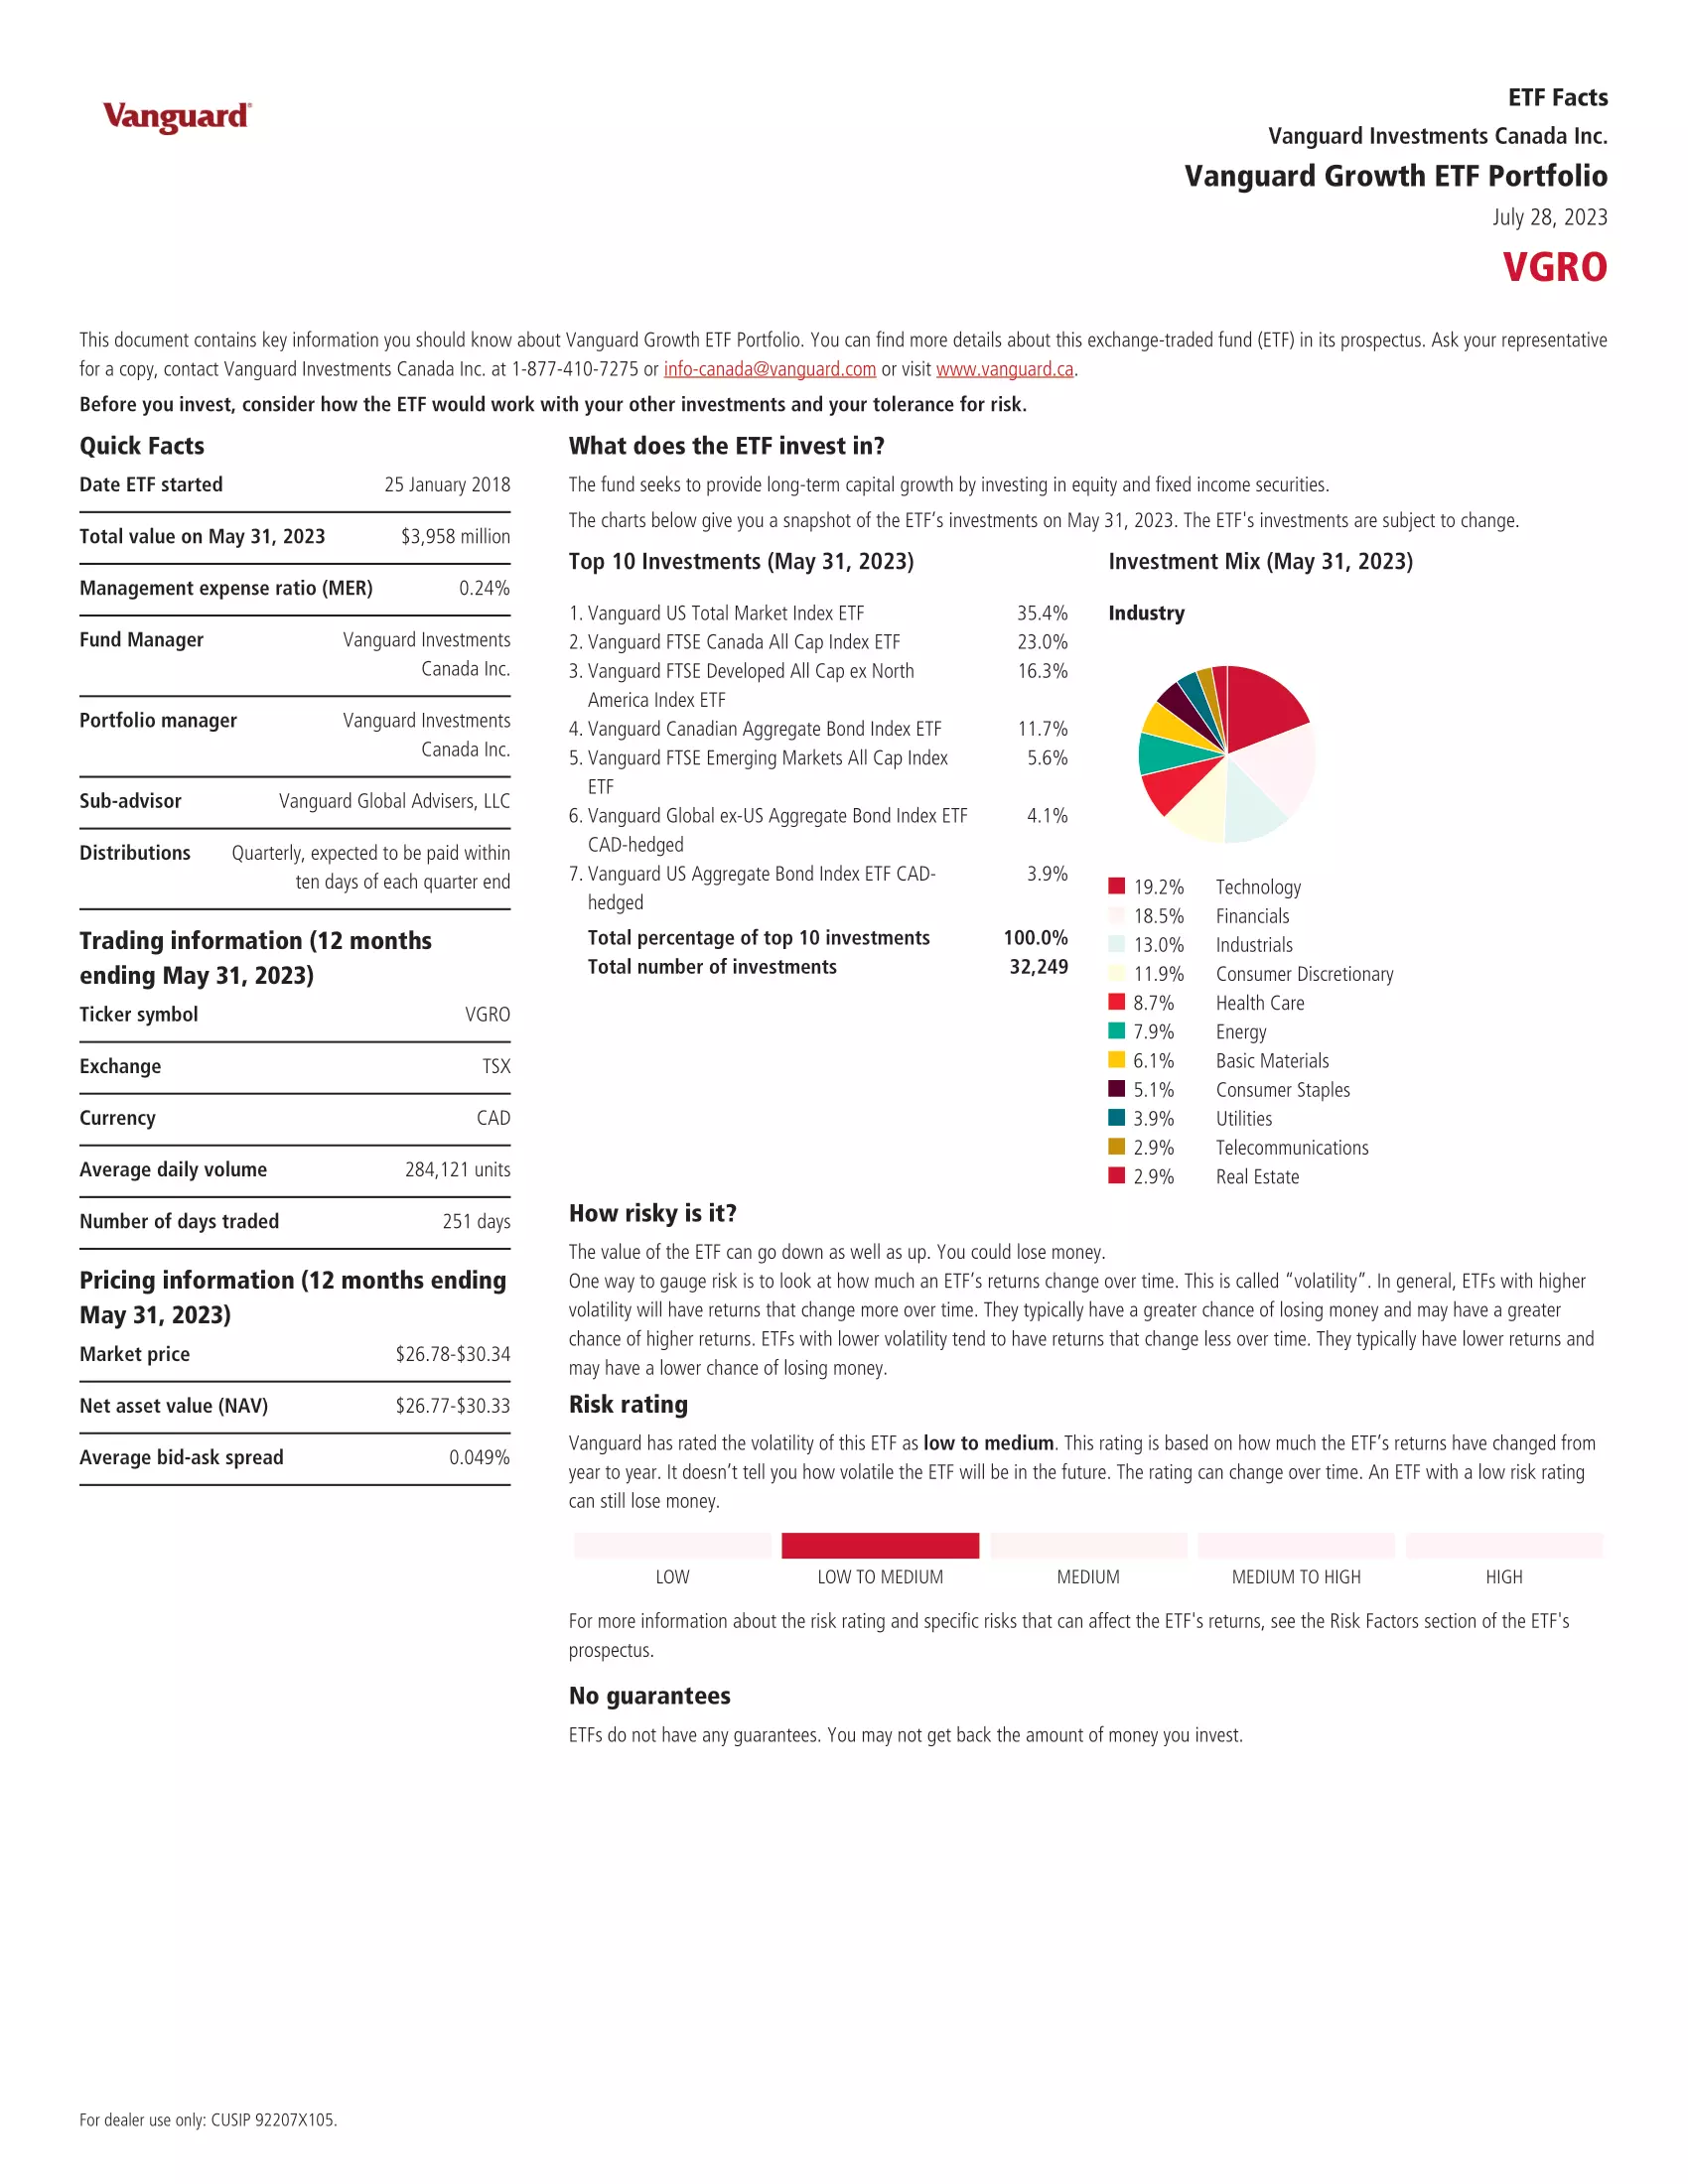
Vanguard Growth ETF Portfolio (VGRO.TO) seeks to provide long-term capital growth by investing in equity and fixed-income securities.
VGRO ETF Review
- Seeks to achieve its investment objective by primarily investing in equity and fixed income securities. It may do so either directly or indirectly through investment in one or more exchange traded funds managed by the manager or an affiliate or certain other investment funds
- In seeking to achieve the investment objective (under normal market conditions), the sub-advisor will strive to maintain a long-term strategic asset allocation of equity (approximately 80%) and fixed income (approximately 20%) securities. The portfolio asset mix may be reconstituted and rebalanced from time to time at the discretion of the sub-advisor
- The underlying funds are expected to be index funds that provide exposure to broad-based equity and fixed income markets
| Manager | Vanguard |
| Ticker | VGRO |
| Risk | Low to Medium |
| Inception | 2018-01-25 |
| MER | 0.24% |
| AUM | $5,060,000,000 |
| Holdings | 32,249 |
| Beta | 1.06 |
| P/E | 16.58 |
| Dividend | $0.220600 |
| Yield | 2.08% |
| Distributions | Quarterly |
Top VGRO Holdings
The top 10 investments of VGRO account for 100% of the 7 total holdings.
| Name | Weight |
|---|---|
| Vanguard U.S. Total Market Index ETF | 37.02% |
| Vanguard FTSE Canada All Cap Index ETF | 23.32% |
| Vanguard FTSE Developed All Cap ex North America Index ETF | 15.34% |
| Vanguard Canadian Aggregate Bond Index ETF | 11.29% |
| Vanguard FTSE Emerging Markets All Cap Index ETF | 5.25% |
| Vanguard Global ex-U.S. Aggregate Bond Index ETF (CAD-hedged) | 3.98% |
| Vanguard U.S. Aggregate Bond Index ETF (CAD-hedged) | 3.80% |
VGRO Performance
Quickly compare VGRO to other investments focused on growth allocation funds by fees, performance, yield, and other metrics to decide which ETF fits in your portfolio.
| Manager | ETF | Inception | MER | AUM | Holdings | Beta | P/E | Yield | Distributions | 1Y | 3Y | 5Y | 10Y | 15Y |
|---|---|---|---|---|---|---|---|---|---|---|---|---|---|---|
| GGRO | 2020-09-02 | 0.25% | $79,993,053 | 12* | 1.12 | 20.34 | 1.78% | Quarterly | 21.60% | 8.22% | N/A | N/A | N/A | |
| XGRO | 2007-06-21 | 0.20% | $2,148,072,849 | 31* | 1.08 | 16.93 | 2.17% | Quarterly | 16.86% | 7.05% | 8.80% | 7.28% | 9.07% | |
| ZGRO | 2023-01-23 | 0.20% | $263,320,000 | 9* | 1.06 | N/A | 2.17% | Quarterly | 16.61% | 7.25% | 8.68% | N/A | N/A | |
| ZGRO.T | 2023-01-23 | 0.20% | $3,100,000 | 9* | N/A | N/A | 5.60% | Monthly | 16.61% | N/A | N/A | N/A | N/A | |
| CGRO | 2023-05-17 | N/A | $2,230,000 | 6* | N/A | N/A | N/A | Quarterly | N/A | N/A | N/A | N/A | N/A | |
 | FGRO | 2021-01-21 | 0.42% | $395,700,000 | 1,589 | 1.08 | 15.25 | 1.30% | Annually | 22.87% | 11.06% | N/A | N/A | N/A |
| GRCC | 2023-10-10 | N/A | $4,793,938 | 9* | N/A | N/A | N/A | Monthly | N/A | N/A | N/A | N/A | N/A | |
| HGRW | 2023-10-10 | N/A | $9,102,448 | 8* | N/A | N/A | N/A | Monthly | N/A | N/A | N/A | N/A | N/A | |
| MGRW | 2020-09-29 | 0.19% | $28,596,036 | 8* | 1.05 | 17.20 | 2.18% | Quarterly | 17.55% | 7.59% | N/A | N/A | N/A | |
| VGRO | 2018-01-25 | 0.24% | $5,060,000,000 | 32,249 | 1.06 | 16.58 | 2.08% | Quarterly | 16.45% | 6.70% | 8.46% | N/A | N/A |
 |  |  |  |  |  |
|---|---|---|---|---|---|
| Advice | InvestCAN | InvestRESP | InvestUSA | RetireCAN | RetireMGN |
| $500.00 CAD $400.00 USD | $99.99 CAD | $79.99 USD | $99.99 CAD | $12.99 CAD $9.99 USD |
 Rishi Vikram2024-06-03Nic is client focused advisor . Honest advice is rare in today’s world But Nic gave good ,Simple and to the point information.
 Sunny2024-02-29Nic's vast knowledge in financial investments is exceptional. Highly recommended.
 Peter Vigna2024-01-27Nic is the best source for financial education on social media best etf recommendations.
 519 Painting2023-05-01Nick was a tremendous help with our financial planning for our new company!
 Shiella A2022-06-30Nic is professional, intuitive, personable and passionate about his role. We are so gald to have Nic as our financial advisor; our portfolios are well managed and we have been happy with the outcomes over the years. Nic always goes out of his way to help us. We had a bad experience with our Canada life mortgage broker, his lack of support and responsiveness almost cost our family a great opportunity so we had to move on. We honestly wish Nic was able to handle our mortgage needs as well. This will ensure that all our service needs will be well managed. Thank you Nic for everything you do!
 Jake Thuss2022-06-25Nic is the best financial advisor I have come across in London, Ontario. He knowledgeably helped us with our investments, life insurance and a mortgage. He is a great financial planner to deal with!
 John Vella2021-06-10This was my first experience with a financial planner. Nic took the time to explain everything to me. He is very patient and thorough. We talked about my goals and plans for retirement. We also talked about my comfort level when it comes to the the ups and downs of investing. I felt very comfortable with Nic. He is down to earth and very knowledgeable. I would highly recommend Nic to anyone needing a financial planner. I feel much more comfortable with my investment plan because of Nic and look forward to working with him for all my investment needs.
 Jimal Isovski2021-05-11My experience dealing with Nic was flawless. He was extremely informative, supportive and organized when dealing with all my questions and investments. He truly looks out for his clients and does whatever it takes to go above and beyond for their success.
 Karen Campbell2021-05-10Nic always has your best interest in mind. Very knowledgeable, respectful of your time and very keen. Trust-worthy too.