
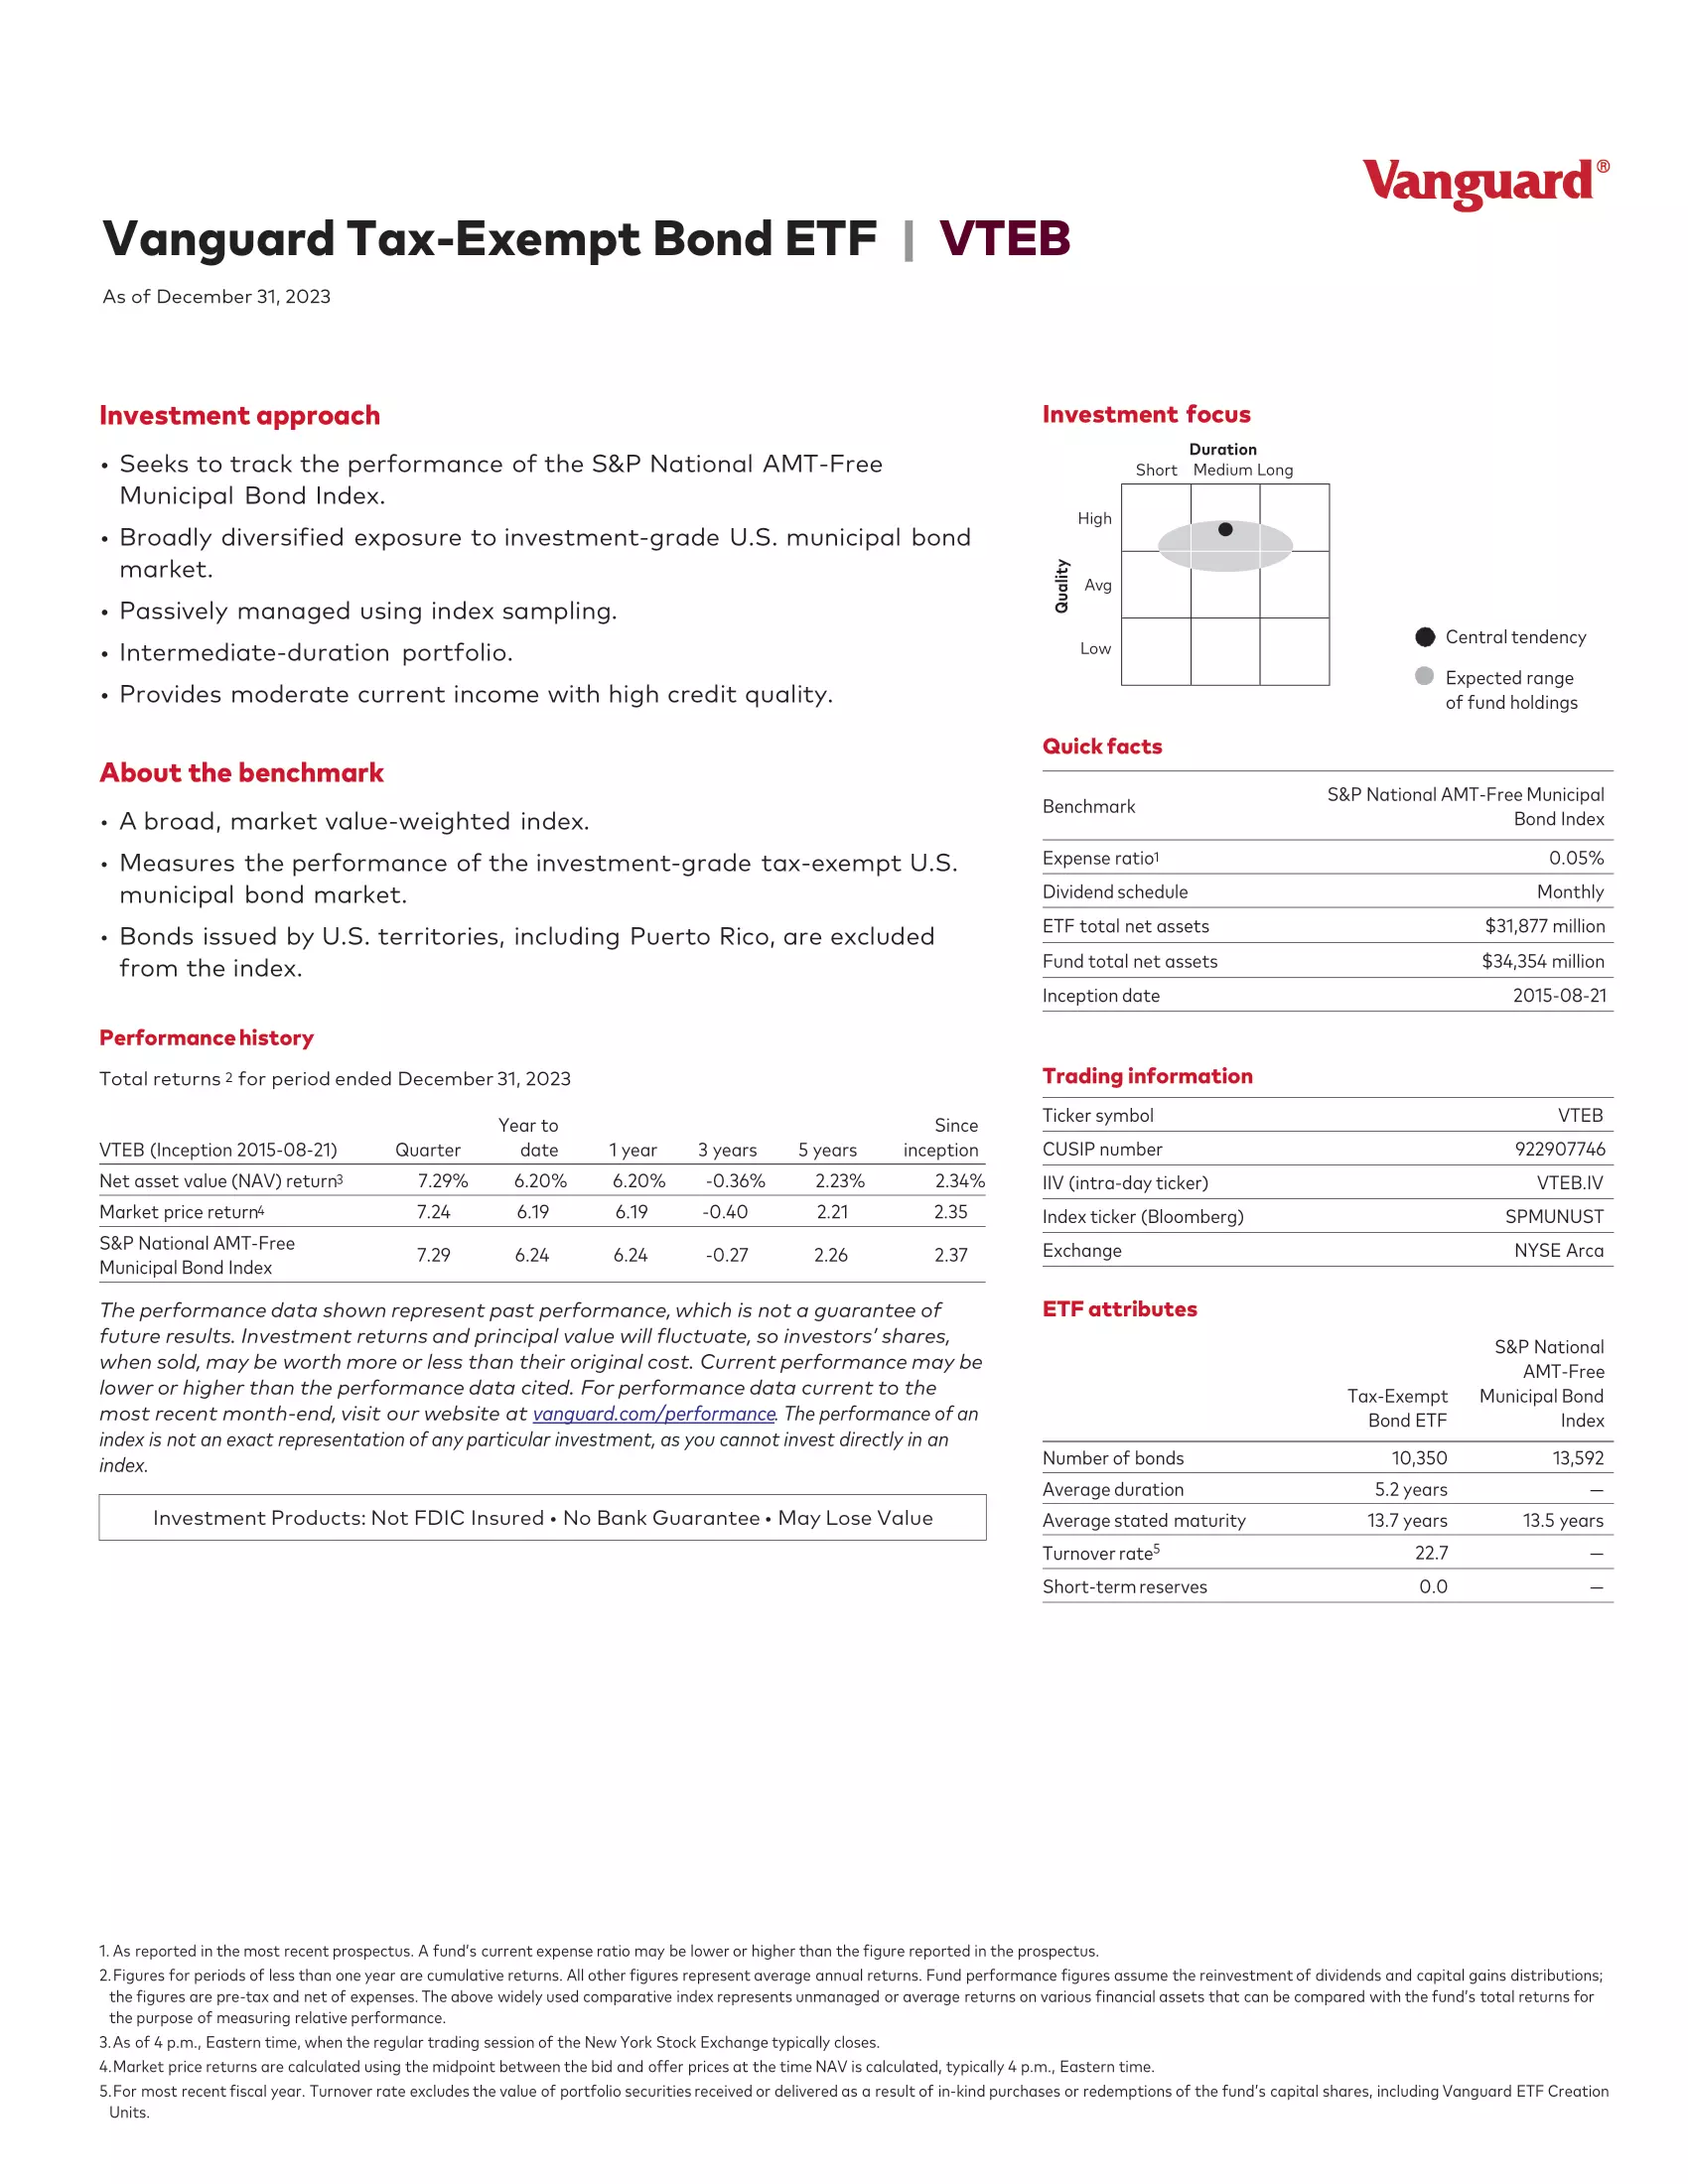
Vanguard Tax-Exempt Bond Index Fund ETF (VTEB) seeks to tracks the performance of a benchmark index that measures the investment-grade segment of the U.S. municipal bond market. The fund employs an indexing investment approach designed to track the Standard & Poor’s National AMT-Free Municipal Bond Index using a sampling technique to closely match key benchmark characteristics.
VTEB ETF Review
All of the fund’s investments will be selected through the sampling process, and at least 80% of the fund’s assets will be invested in securities held in the index. Under normal circumstances, at least 80% of the fund’s assets will be invested in securities whose income will be exempt from federal income taxes and the federal alternative minimum tax. Risks of the fund include the fact that changes in interest rates can affect the fund by resulting in lower bond prices (when interest rates go up) or an eventual decrease in income for the fund (when rates decline). Investors who are looking for a fund that may provide federal tax-exempt income and can tolerate moderate price and income fluctuations may wish to consider this fund.
| Manager | Vanguard |
| Ticker | VTEB |
| Risk | 2 |
| Inception | 2015-08-21 |
| MER | 0.05% |
| AUM | $31,900,000,000 |
| Holdings | 10429 |
| Beta | 0.96 |
| P/E | N/A |
| Dividend | $0.127900 |
| Yield | 2.84% |
| Distributions | Monthly |
VTEB Performance
Quickly compare VTEB to other investments focused on tax-exempt bonds by fees, performance, yield, and other metrics to decide which ETF fits in your portfolio.
| Manager | ETF | Inception | MER | AUM | Yield | Distributions | 1Y | 3Y | 5Y | 10Y | 15Y |
|---|---|---|---|---|---|---|---|---|---|---|---|
| TAXF | 2018-09-10 | 0.29% | $402,330,007 | 2.93% | Monthly | 3.91% | -0.39% | 2.62% | N/A | N/A | |
 | AVMU | 2020-12-10 | 0.15% | $139,697,907 | 2.51% | Monthly | 2.40% | -0.89% | N/A | N/A | N/A |
| STIP | 2010-12-01 | 0.03% | $8,252,763,555 | 2.83% | Monthly | 4.24% | 2.33% | 3.35% | 1.98% | N/A | |
| CGMU | 2022-10-25 | 0.27% | $585,400,000 | 3.13% | Monthly | 4.08 | N/A | N/A | N/A | N/A | |
| SCHP | 2010-08-05 | 0.03% | $11,225,211,314 | 3.02% | Monthly | 2.21% | -1.08% | 2.84% | 2.17% | N/A | |
| DFNM | 2021-11-15 | 0.17% | $1,200,000,000 | 2.29% | Monthly | 2.06% | N/A | N/A | N/A | N/A | |
| MFLX | 2016-09-27 | 0.88% | $16,959,115 | 3.65% | Monthly | 5.28% | -2.44% | 2.52% | N/A | N/A | |
| TDTT | 2011-09-19 | 0.19% | $1,830,000,000 | 3.86% | Monthly | 3.87% | 1.59% | 3.39% | 1.93% | N/A | |
| FLMB | 2017-08-31 | 0.30% | $113,920,000 | 3.49% | Monthly | 3.57% | -1.75% | 2.08% | N/A | N/A | |
 | GTIP | 2018-10-02 | 0.12% | $117,440,000 | 2.76% | Monthly | 2.22% | -1.13% | 2.79% | N/A | N/A |
| HMOP | 2017-12-13 | 0.29% | $402,197,742 | 2.97% | Monthly | 4.05% | -0.38% | 2.40% | N/A | N/A | |
| PBTP | 2017-09-19 | 0.07% | $66,700,000 | 2.35% | Quarterly | 4.32% | 2.25% | 3.22% | N/A | N/A | |
| JMUB | 2018-10-29 | 0.18% | $1,170,000,000 | 3.20% | Monthly | 3.41% | -0.14% | 2.44% | N/A | N/A | |
| HYMB | 2011-04-13 | 0.35% | $2,356,420,000 | 4.05% | Monthly | 4.38% | -1.63% | 1.97% | 3.62% | N/A | |
| HYD | 2009-02-04 | 0.32% | $2,940,000,000 | 4.14% | Monthly | 5.50% | -1.93% | 0.18% | 3.01% | 5.05% | |
| VTEB | 2015-08-21 | 0.05% | $31,900,000,000 | 2.84% | Monthly | 2.83% | -0.30% | 1.62% | N/A | N/A | |
 | MTGP | 2019-11-12 | 0.45% | $47,743,570 | 3.16% | Monthly | 1.47% | -2.69% | N/A | N/A | N/A |
| RVNU | 2013-06-04 | 0.15% | $118,630,000 | 2.79% | Monthly | 5.33% | -1.99% | 2.11% | 3.55% | N/A | |
| Manager | ETF | Inception | MER | AUM | Yield | Distributions | 1Y | 3Y | 5Y | 10Y | 15Y |
 |  |  |  |  |  |
|---|---|---|---|---|---|
| Advice | InvestCAN | InvestRESP | InvestUSA | RetireCAN | RetireMGN |
| $500.00 CAD $400.00 USD | $99.99 CAD | $79.99 USD | $99.99 CAD | $12.99 CAD $9.99 USD |
 Rishi Vikram2024-06-03Nic is client focused advisor . Honest advice is rare in today’s world But Nic gave good ,Simple and to the point information.
 Sunny2024-02-29Nic's vast knowledge in financial investments is exceptional. Highly recommended.
 Peter Vigna2024-01-27Nic is the best source for financial education on social media best etf recommendations.
 519 Painting2023-05-01Nick was a tremendous help with our financial planning for our new company!
 Shiella A2022-06-30Nic is professional, intuitive, personable and passionate about his role. We are so gald to have Nic as our financial advisor; our portfolios are well managed and we have been happy with the outcomes over the years. Nic always goes out of his way to help us. We had a bad experience with our Canada life mortgage broker, his lack of support and responsiveness almost cost our family a great opportunity so we had to move on. We honestly wish Nic was able to handle our mortgage needs as well. This will ensure that all our service needs will be well managed. Thank you Nic for everything you do!
 Jake Thuss2022-06-25Nic is the best financial advisor I have come across in London, Ontario. He knowledgeably helped us with our investments, life insurance and a mortgage. He is a great financial planner to deal with!
 John Vella2021-06-10This was my first experience with a financial planner. Nic took the time to explain everything to me. He is very patient and thorough. We talked about my goals and plans for retirement. We also talked about my comfort level when it comes to the the ups and downs of investing. I felt very comfortable with Nic. He is down to earth and very knowledgeable. I would highly recommend Nic to anyone needing a financial planner. I feel much more comfortable with my investment plan because of Nic and look forward to working with him for all my investment needs.
 Jimal Isovski2021-05-11My experience dealing with Nic was flawless. He was extremely informative, supportive and organized when dealing with all my questions and investments. He truly looks out for his clients and does whatever it takes to go above and beyond for their success.
 Karen Campbell2021-05-10Nic always has your best interest in mind. Very knowledgeable, respectful of your time and very keen. Trust-worthy too.