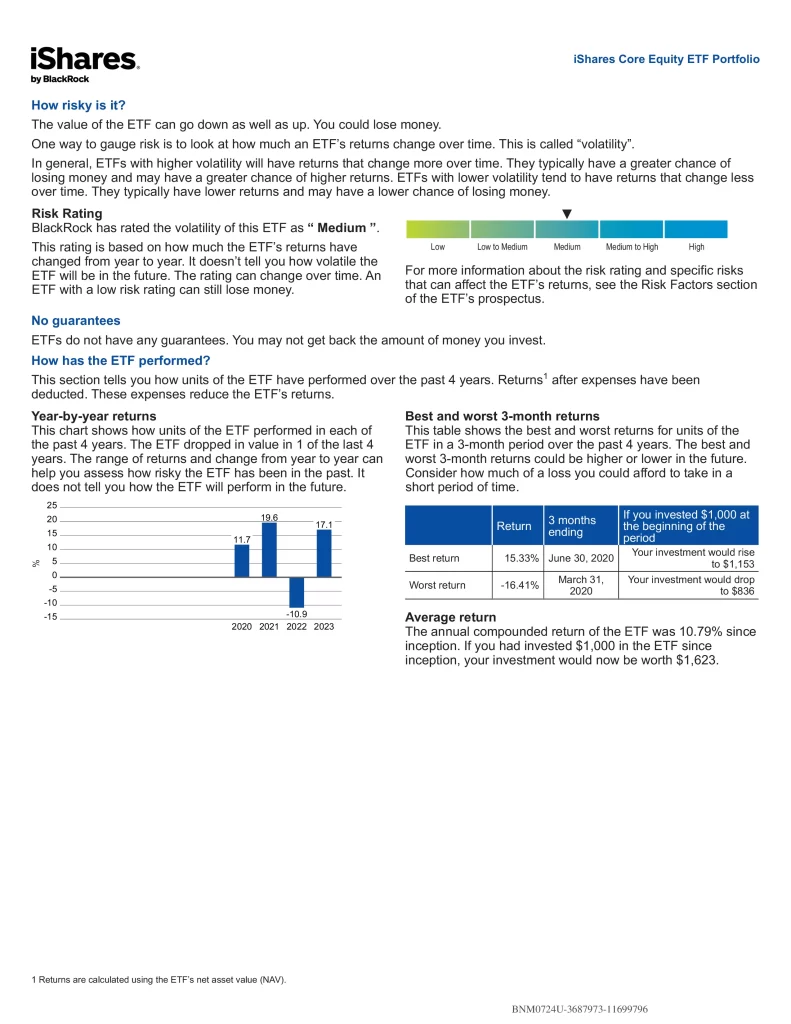
You can find more details about this Exchange Traded Fund (ETF) in its prospectus. Before you invest, consider how the ETF would work with your other investments and your risk tolerance. The value of the ETF can go down as well as up. You could lose money. ETFs do not have any guarantees. You may not get back the amount of money you invest. You may have to pay a commission every time you buy and sell units of the ETF. Commissions may vary by brokerage firm.
XEQT ETF Review
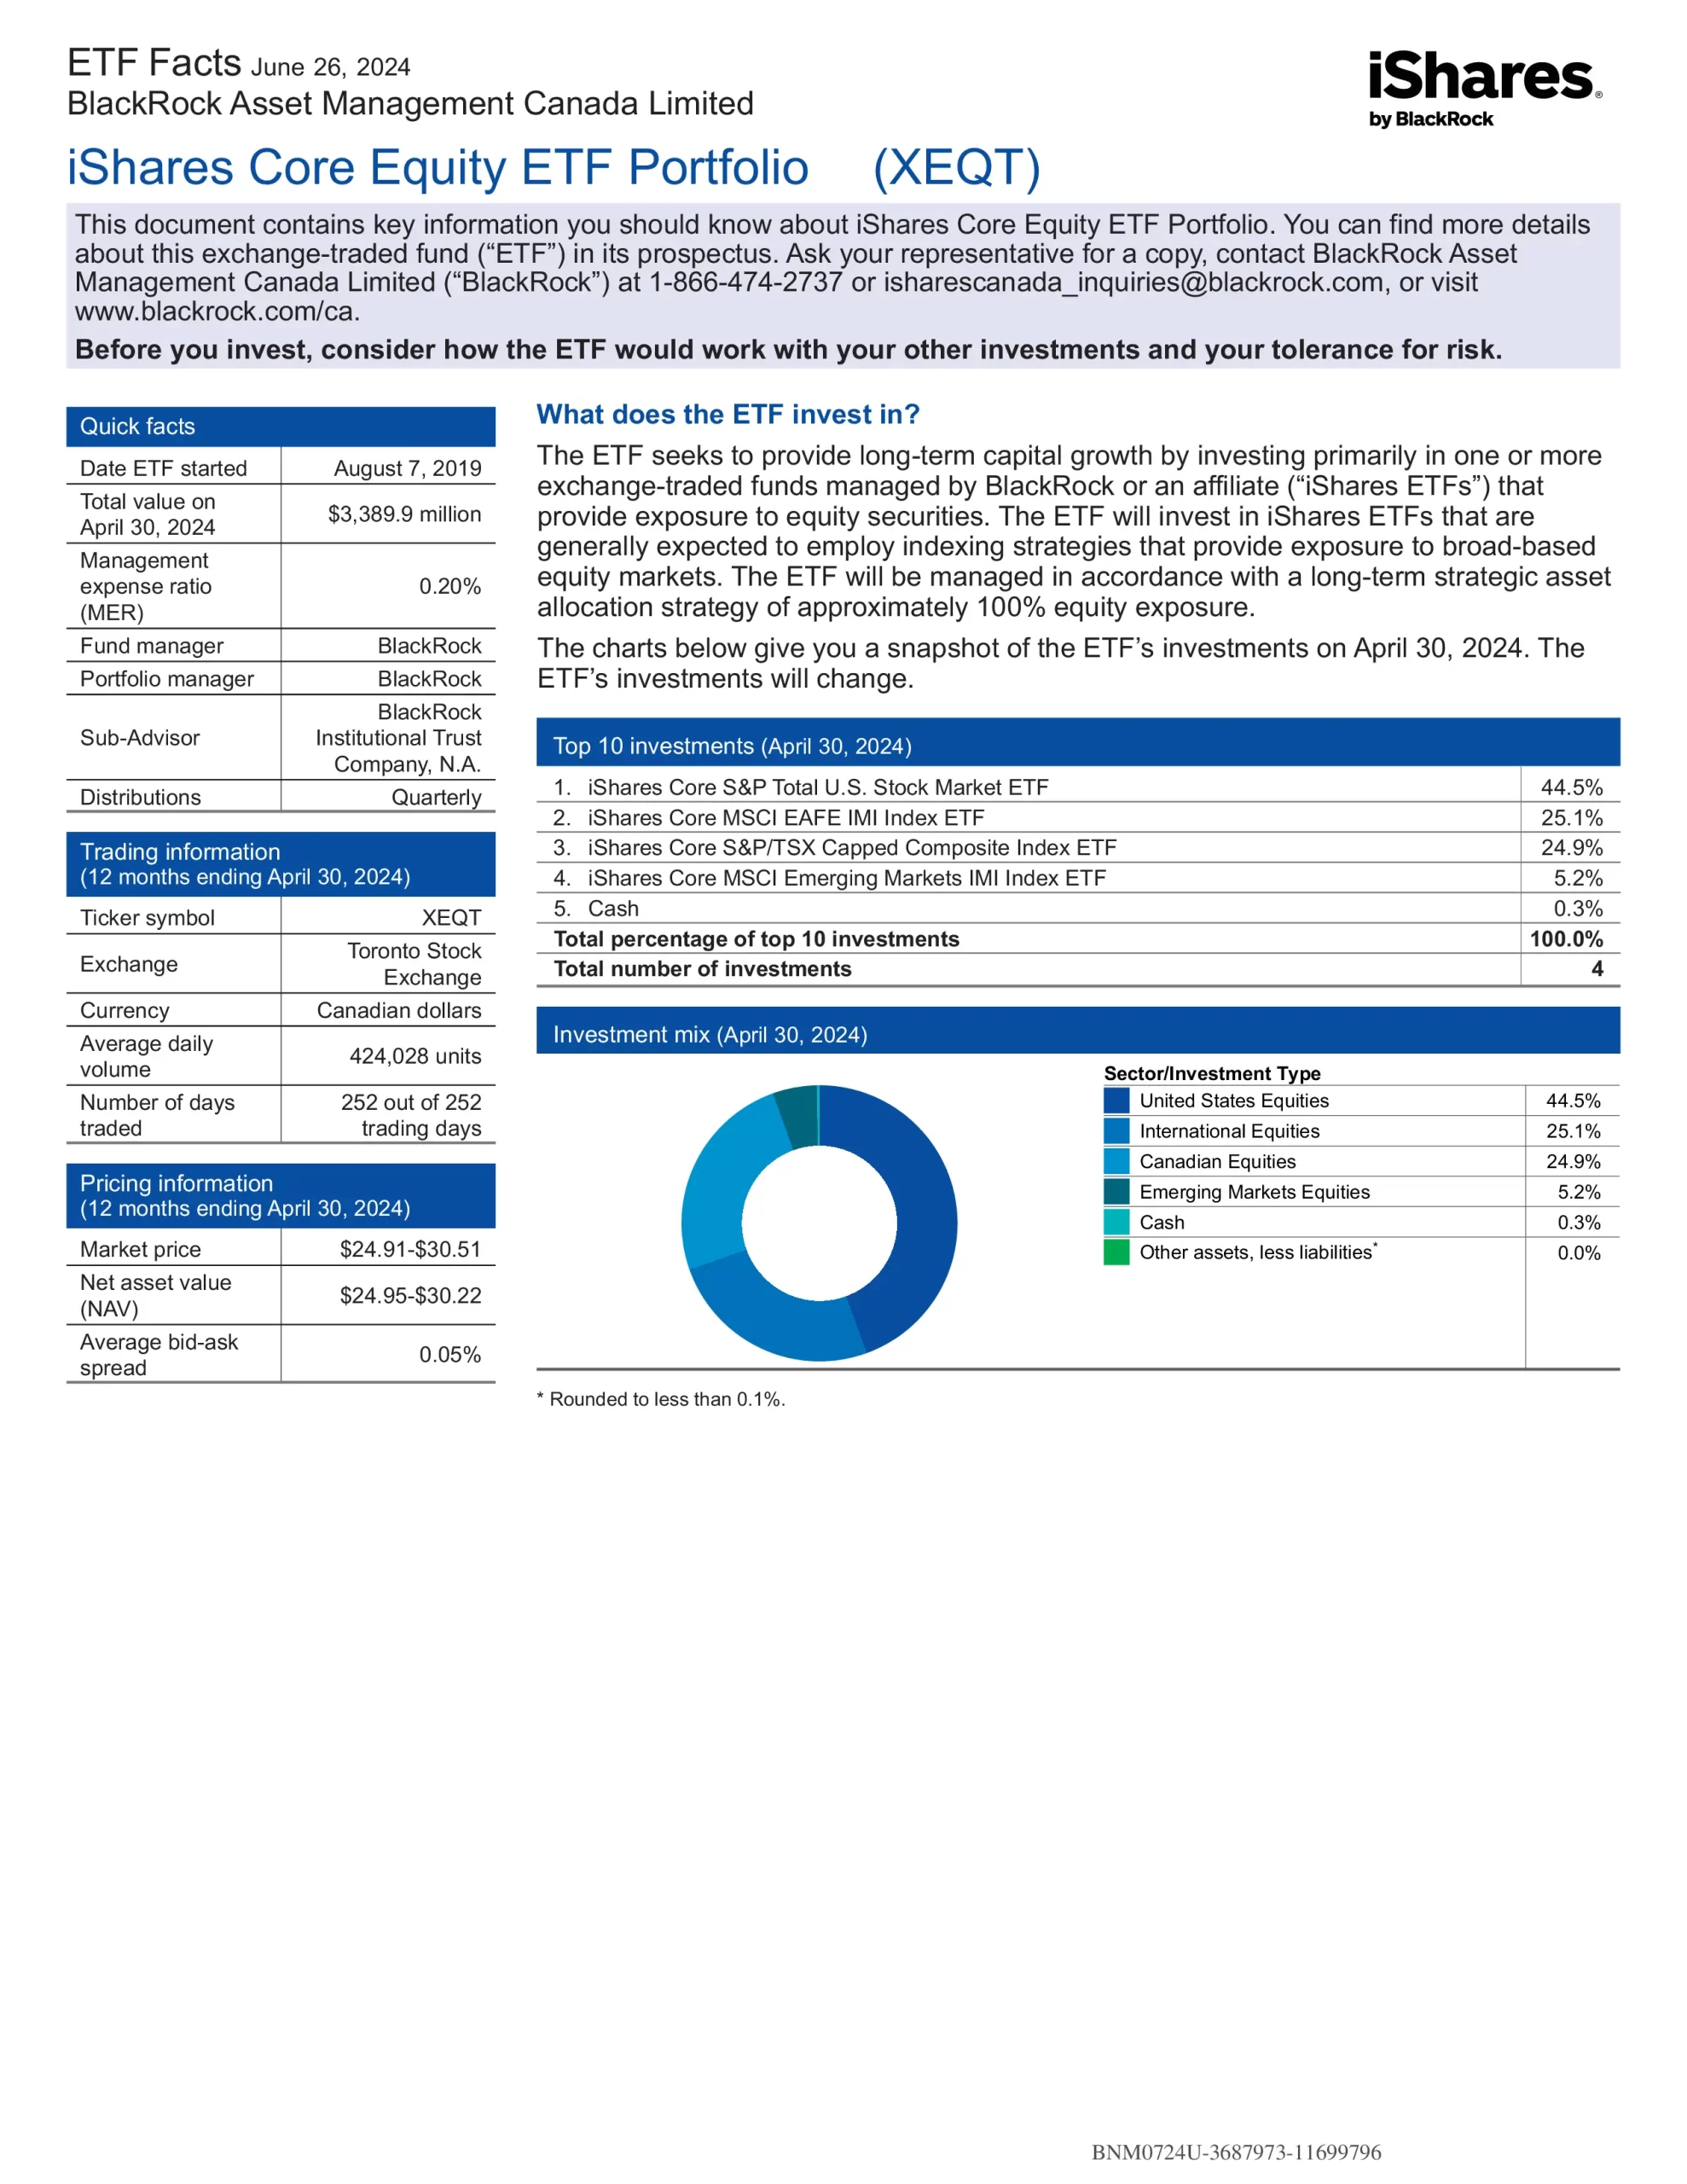
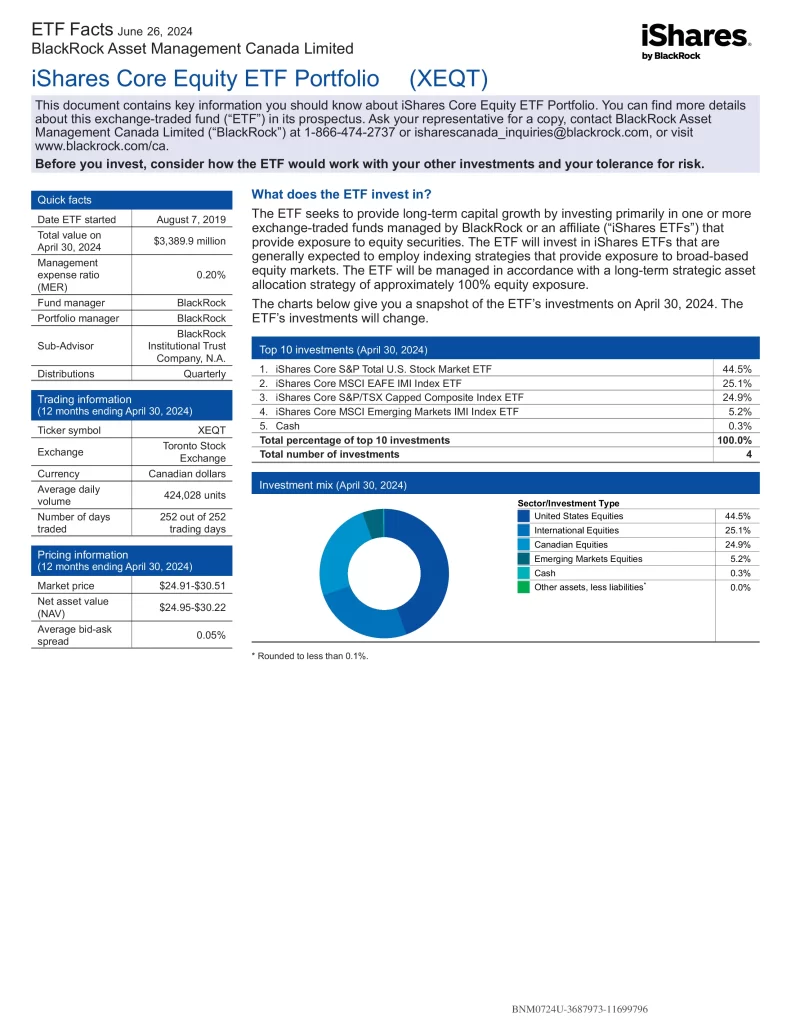
iShares Core Equity ETF Portfolio (XEQT) seeks to provide long-term capital growth by investing primarily in one or more exchange-traded funds (ETFs) that provide exposure to equity securities. XEQT is designed to be a simple, one-ticket solution to help investors reach their long-term investment goals by adhering to a strategic target asset allocation. The ETF will be managed following a long-term strategic asset allocation strategy of approximately 100% equity exposure.
- A simple way to gain exposure to a portfolio of ETFs that is broadly diversified across regions
- Continuously monitored and automatically rebalanced
- A low cost fee structure that allows investors to keep more of what they earn
Top XEQT Holdings
XEQT is a fund of fund investment holding multiple ETFs to build a diversified portfolio all-in-one investment.
| Ticker | Name | Weight |
|---|---|---|
| ITOT | iShares Core S&P Total U.S. Stock Market ETF | 47.41% |
| XEF | iShares Core MSCI EAFE IMI Index ETF | 23.84% |
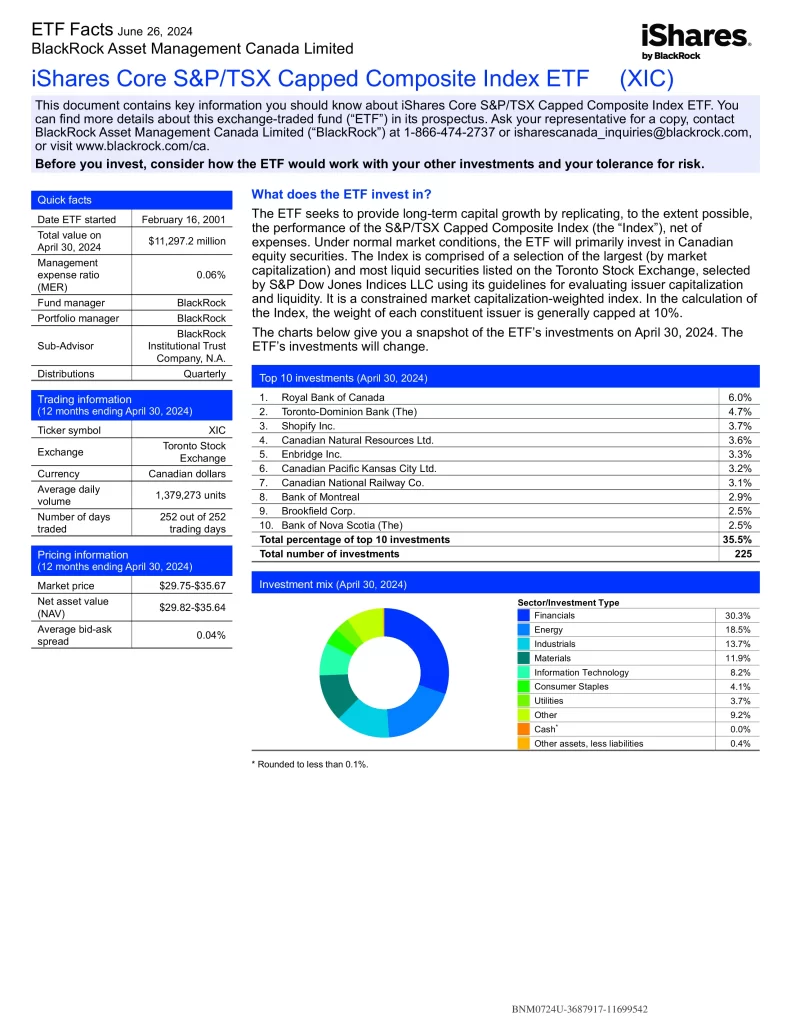
| XIC | iShares Core S&P/TSX Capped Composite Index ETF | 23.70% |
| XEC | iShares Core MSCI Emerging Markets IMI Index ETF | 4.64% |
Is XEQT a Good Investment?
Quickly compare XEQT to other investments focused on asset allocation by fees, performance, yield, and other metrics to decide which ETF fits in your portfolio.
| Manager | ETF | Risk | Inception | MER | AUM | Beta | P/E | Yield | Distributions | 1Y | 3Y | 5Y | 10Y | 15Y |
|---|---|---|---|---|---|---|---|---|---|---|---|---|---|---|
| BlackRock | XEQT | Medium | 2019-08-07 | 0.20% | $3,863,324,506 | 0.99 | 17.74 | 1.90% | Quarterly | 22.07% | 8.67% | N/A | N/A | N/A |
| BMO | ZEQT | Medium | 2022-01-17 | 0.20% | $93,270,000 | N/A | N/A | 1.93% | Quarterly | 22.13% | N/A | N/A | N/A | N/A |
| CI | CEQT | Medium | 2023-05-17 | N/A | $5,800,000 | N/A | N/A | N/A | Quarterly | 17.85% | N/A | N/A | N/A | N/A |
| Fidelity | FEQT | Medium | 2022-01-25 | 0.43% | $369,800,000 | N/A | N/A | 1.17% | Annually | 28.83% | N/A | N/A | N/A | N/A |
| Global X | HEQT | Medium | 2019-09-13 | 0.17% | $234,926,486 | 1.17 | N/A | 1.54% | Monthly | 22.70% | 6.80% | N/A | N/A | N/A |
| Vanguard | VEQT | Medium | 2019-01-29 | 0.24% | $4,290,000,000 | 0.96 | 17.41 | 1.71% | Annually | 21.57% | 8.27% | 11.00% | N/A | N/A |
XEQT vs VEQT
XEQT is the better ETF with more frequent distributions. XEQT is the superior performing, less expensive ETF than VEQT which is older and more popular.
XEQT vs VFV
VFV is the better ETF. VFV is the superior performing, more popular and less expensive ETF than XEQT.
XEQT vs VGRO
XEQT is the better and ETF. XEQT is the superior performing, more popular and less expensive ETF than VGRO. This is mainly due to its higher stock allocation.
XEQT vs XAW
XAW is the better ETF. XAW is the superior performing and more popular ETF than XEQT which is less expensive.
XEQT vs XEI
XEI is the better ETF. XEI is the superior performing and more popular ETF than XEQT which is less expensive.
XEQT vs XGRO
XEQT is the better and riskier ETF. XEQT is the superior performing ETF than XEQT which is more popular. This is mainly due to its higher stock allocation.
XEQT vs ZEQT
XEQT is the better ETF. XEQT is the superior performing ETF than ZEQT which is more popular.
Conclusion
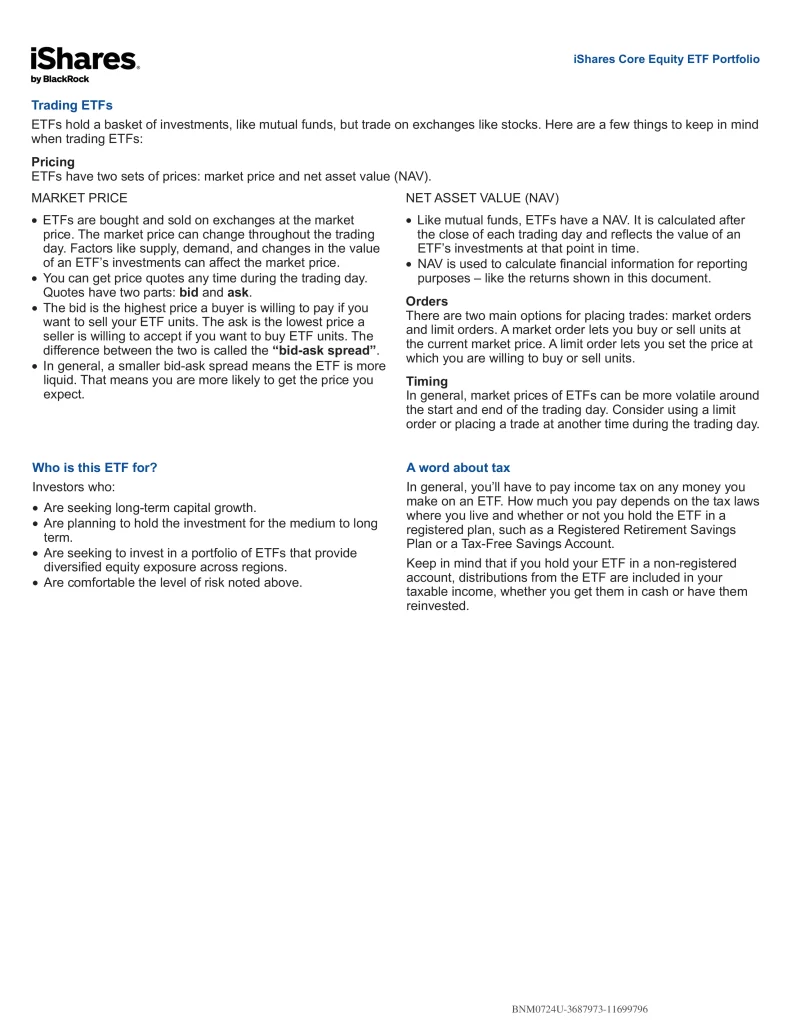
One way to gauge risk is to look at how much an ETF’s returns change over time. This is called volatility. In general, ETFs with higher volatility will have returns that change more over time. They typically have a greater chance of losing money and may have a greater chance of higher returns. ETFs with lower volatility tend to have returns that change less over time. They typically have lower returns and may have a lower chance of losing money. An ETF with a low-risk rating can still lose money. The bid is the highest price a buyer is willing to pay if you want to sell your ETF units. The ask is the lowest price a seller is willing to accept if you want to buy ETF units. The difference between the two is called the bid-ask spread. In general, a smaller bid-ask spread means the ETF is more liquid. That means you are more likely to get the price you expect. In general, market prices of ETFs can be more volatile around the start and end of the trading day.

