XIU: iShares S&P/TSX 60 Index ETF
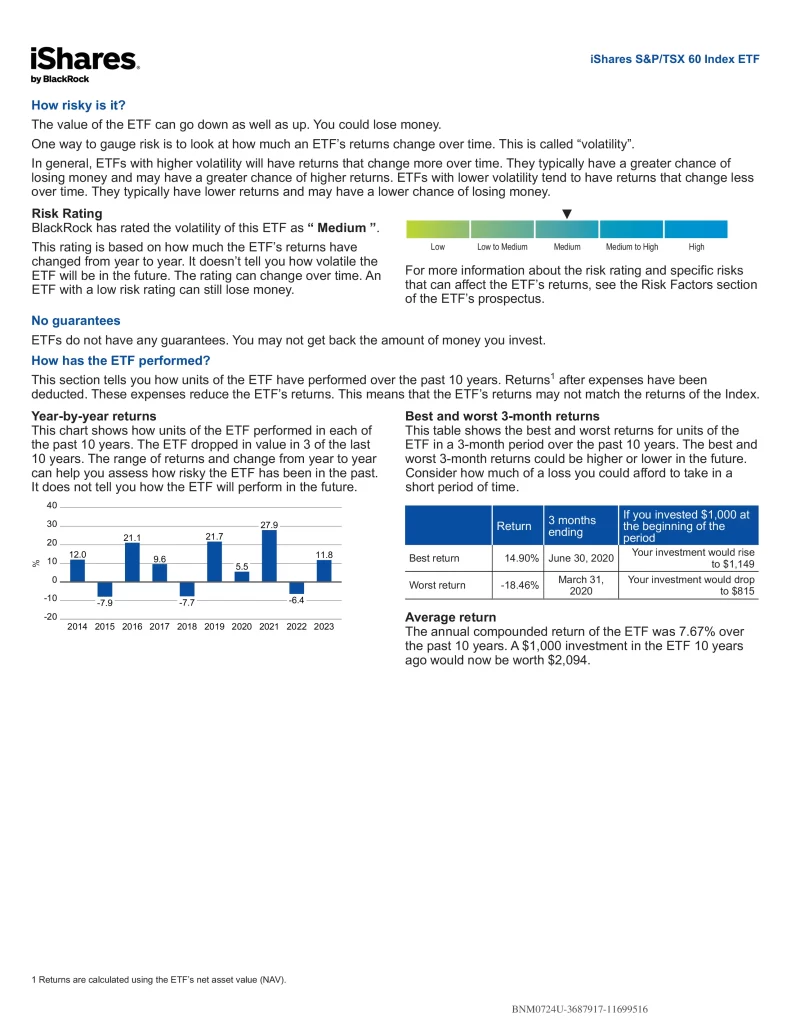
More information about iShares S&P/TSX 60 Index ETF (XIU) is in its prospectus. Before investing, assess how the Exchange Traded Fund (ETF) aligns with your portfolio and risk tolerance. Remember that the value of ETFs can fluctuate, meaning you might lose money. They do not offer guarantees, and you may not recover the full amount of your investment. Additionally, purchasing or selling ETF units may incur commission fees, which can vary between brokerage firms. ETF market prices can also experience higher volatility, especially during the opening and closing of trading sessions. When it comes to investing, confirmation bias can be particularly harmful because it leads investors to make decisions based on incomplete or skewed information, potentially reducing their chances of success. Herding may also be involved as it is the tendency of investors to follow the behavior of the majority or “crowd” on social media, rather than making independent, well-researched decisions.
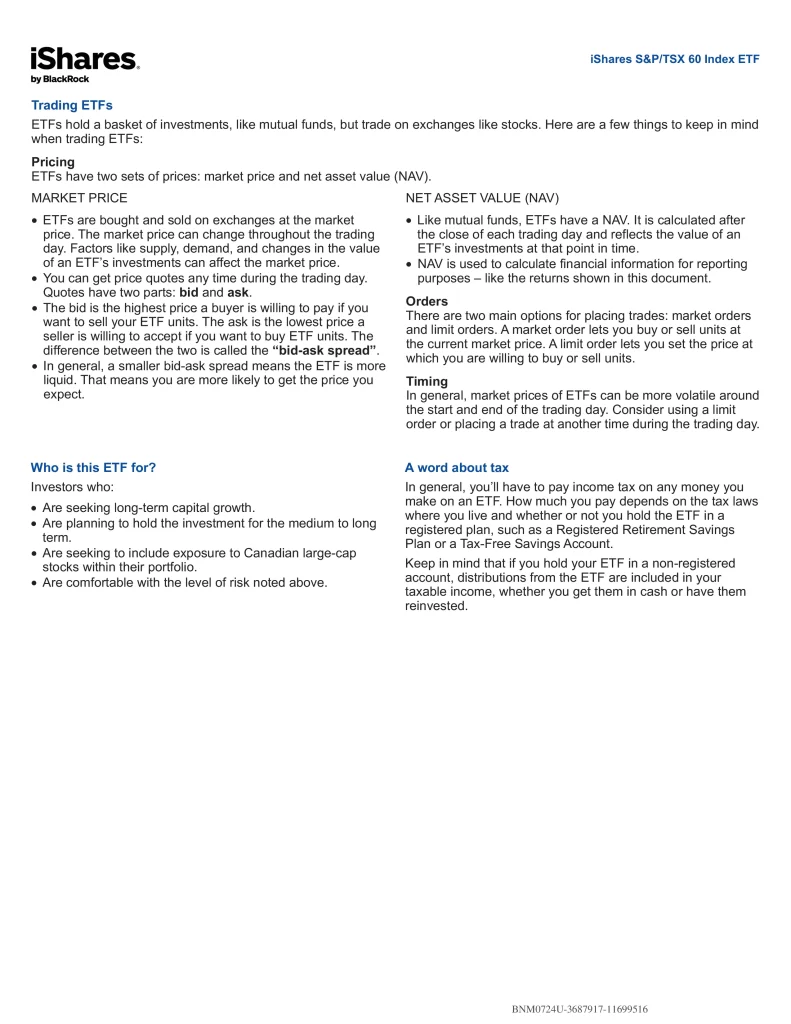
Investing during inflation may seem counterintuitive at first, but it can be a smart strategy for preserving and growing your wealth. Dollar-cost averaging is a popular investment strategy that involves regularly investing a fixed amount of money into a particular investment regardless of market conditions to avoid timing the market or loss aversion, which can significantly affect an investor’s behaviour, often leading to suboptimal decision-making. A narrower spread generally indicates higher liquidity, meaning you’re more likely to execute trades at expected prices. Always consider these factors carefully when making investment decisions. Even ETFs rated as low-risk may experience losses under certain market conditions.
XIU ETF Review
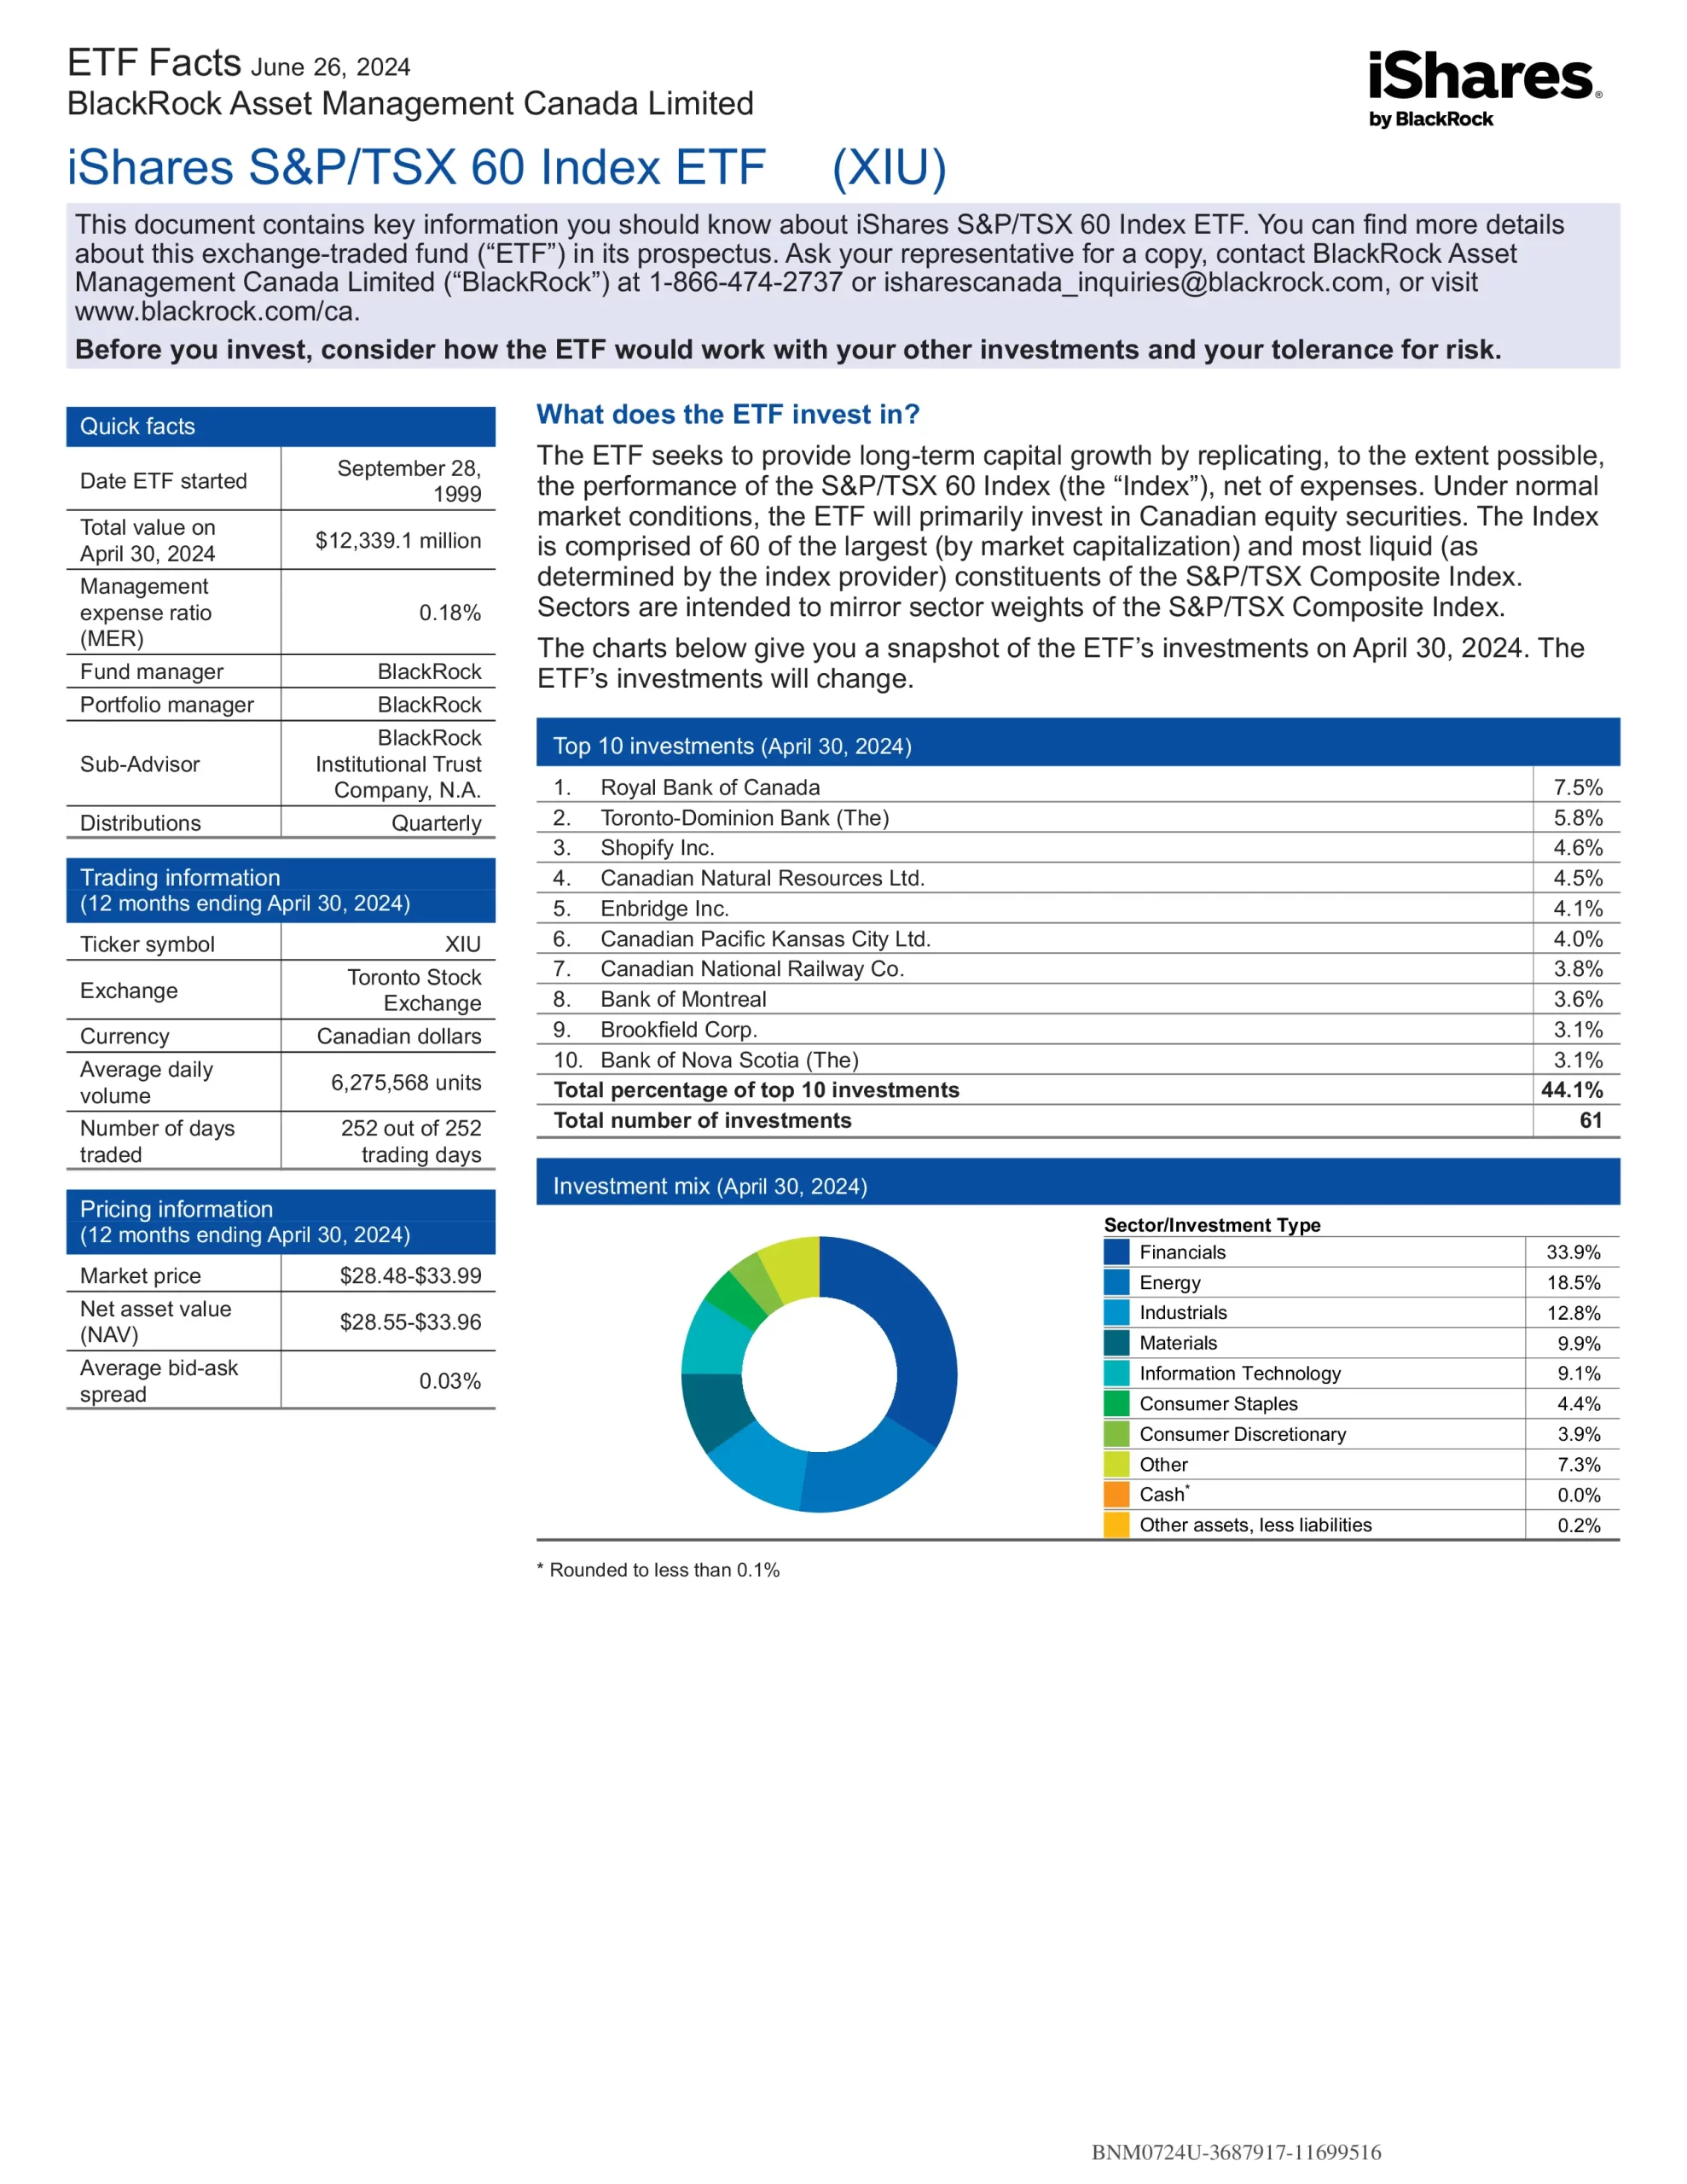
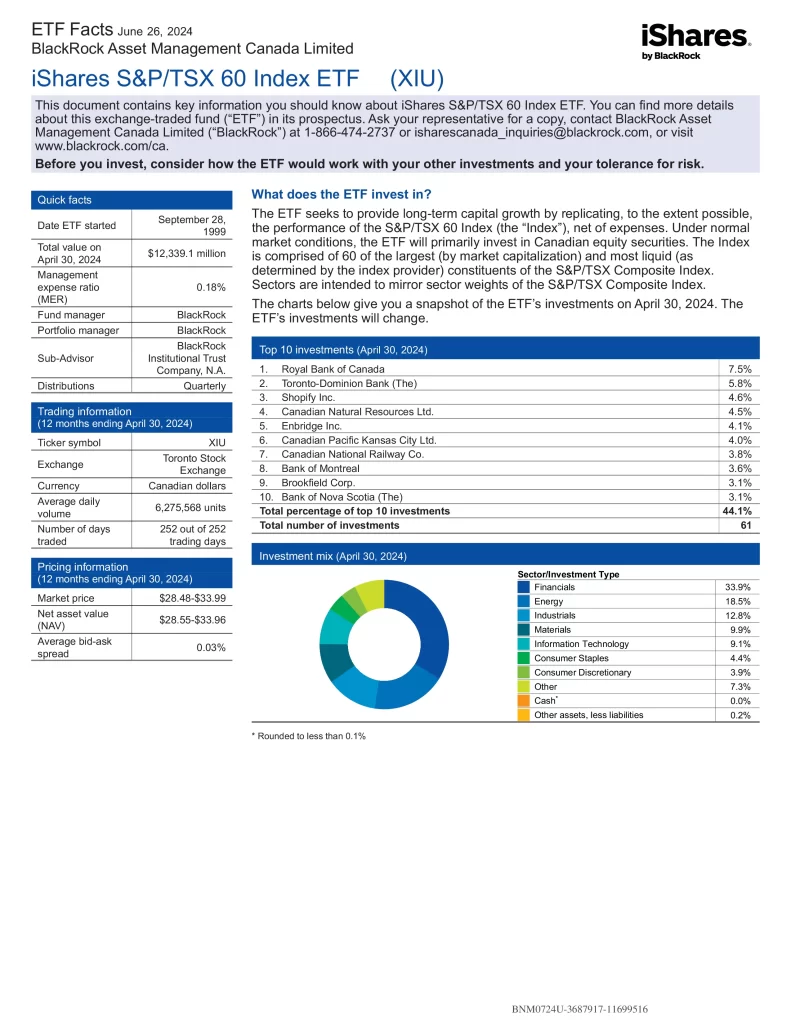
iShares S&P/TSX 60 Index ETF (XIU) seeks to provide long-term capital growth by replicating, to the extent possible, the performance of the S&P/TSX 60 Index. Under normal market conditions, the ETF will primarily invest in Canadian equity securities. The Index is comprised of 60 of the largest (by market capitalization) and most liquid (as determined by the index provider) constituents of the S&P/TSX Composite Index. Sectors are intended to mirror sector weights of the S&P/TSX Composite Index.
- Exposure to large, established Canadian companies
- One of the largest and most liquid ETFs in Canada
- Started trading in 1990, making it the first ETF in the world
Top 10 XIU Holdings
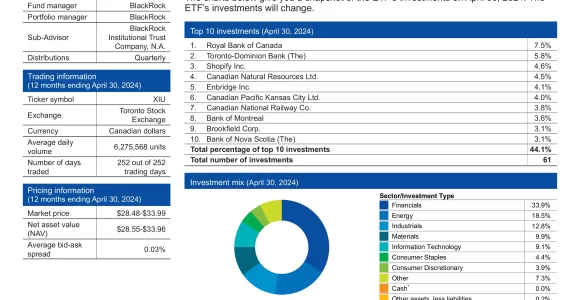
The top 10 holdings of XIU account for 44.1% of the total fund which consists of 61 diversified investments. This table shows the investment names of the individual holdings that are subject to change.
| Ticker | Name | Weight |
|---|---|---|
| RY | Royal Bank of Canada | 8.62% |
| SHOP | Shopify Inc. | 6.87% |
| TD | The Toronto-Dominion Bank | 4.54% |
| ENB | Enbridge Inc. | 4.43% |
| BN | Brookfield Corporation | 4.17% |
| BMO | Bank of Montreal | 3.52% |
| CP | Canadian Pacific Kansas City Limited | 3.38% |
| BNS | The Bank of Nova Scotia | 3.31% |
| CNQ | Canadian Natural Resources Limited | 3.21% |
| CSU | Constellation Software Inc. | 3.13% |
XIU Dividend History
XIU currently has a yield of 2.82% and pays distributions quarterly. Most ETFs will distribute net taxable income to investors at least once a year. This is taxable income if generated from interest, dividends and capital gains by the securities within the ETF. The distributions will either be paid in cash or reinvested in the ETF at the discretion of the manager. This information will be reported in an official tax receipt provided to investors by their broker.
| Ex-Dividend Date | Record Date | Payable Date | Dividend |
|---|---|---|---|
| Nov 21, 2024 | Nov 21, 2024 | Dec 2, 2024 | $0.31500 |
| Aug 27, 2024 | Aug 27, 2024 | Aug 30, 2024 | $0.26600 |
| May 22, 2024 | May 23, 2024 | May 31, 2024 | $0.25900 |
| Feb 23, 2024 | Feb 26, 2024 | Feb 29, 2024 | $0.25400 |
| Dec 28, 2023 | Dec 29, 2023 | Jan 4, 2024 | $0.00000 |
| Nov 21, 2023 | Nov 22, 2023 | Nov 30, 2023 | $0.25200 |
| Aug 25, 2023 | Aug 28, 2023 | Aug 31, 2023 | $0.24500 |
| May 24, 2023 | May 25, 2023 | May 31, 2023 | $0.25700 |
Is XIU a Good ETF?
Quickly compare and contrast XIU to other investments focused on Canadian equities by fees, performance, yield, and other metrics to decide which ETF fits in your portfolio.
| Manager | ETF | Name | Risk | Inception | AUM | MER | P/E | Yield | Beta | Distributions | Holdings | 5Y |
|---|---|---|---|---|---|---|---|---|---|---|---|---|
| BlackRock | XIC | iShares Core S&P/TSX Capped Composite Index ETF | Medium | 2001-02-16 | $14,888,189,750 | 0.06% | 19.11 | 2.41% | 1.00 | Quarterly | 220 | 11.88% |
| BlackRock | XIU | iShares S&P/TSX 60 Index ETF | Medium | 1999-09-28 | $15,103,481,727 | 0.18% | 20.07 | 2.82% | 1.00 | Quarterly | 61 | 12.02% |
| BMO | ZCN | BMO S&P/TSX Capped Composite Index ETF | Medium | 2009-05-29 | $9,556,230,000 | 0.06% | 24.74 | 2.67% | 1.00 | Quarterly | 221 | 11.89% |
| Global X | HXT | Global X S&P/TSX 60 Corporate Class ETF | Medium | 2010-09-14 | $4,236,899,988 | 0.08% | 16.52 | N/A | 1.01 | N/A | 114 | 12.13% |
| Vanguard | VCE | Vanguard FTSE Canada Index ETF | Medium | 2011-11-30 | $2,140,000,000 | 0.06% | 19.56 | 2.69% | 1.00 | Quarterly | 52 | 12.56% |
| Vanguard | VCN | Vanguard FTSE Canada All Cap Index ETF | Medium | 2013-08-02 | $8,520,000,000 | 0.05% | 19.39 | 2.47% | 1.00 | Quarterly | 165 | 12.12% |
| Vanguard | VDY | Vanguard FTSE Canadian High Dividend Yield Index ETF | Medium | 2012-11-02 | $3,320,000,000 | 0.22% | 12.45 | 4.25% | 0.94 | Monthly | 56 | 12.47% |
XIU vs XIC
XIU is the superior performing, older, more popular, higher yielding, less volatile ETF than XIC which is better value, less expensive and more diversified.
XIU vs VDY
VDY is the superior performing, better value, higher yielding, less volatile ETF than XIU which is older, more popular, less expensive and more diversified.
XIU vs VCN
VCN is the superior performing, better value, higher yielding, less volatile ETF than XIU which is older, more popular, less expensive and more diversified.
XIU vs ZCN
XIU is the superior performing, older, more popular, better value, higher yielding, less volatile ETF than ZCN which is less expensive and more diversified.
XIU vs HXT
HXT is the superior performing, better value, higher yielding, less volatile ETF than XIU which is older, more popular, less expensive and more diversified.
XIU vs VCE
VCE is the superior performing, better value, higher yielding, less volatile ETF than XIU which is older, more popular, less expensive and more diversified.
Conclusion
iShares S&P/TSX 60 Index ETF (XIU) is a convenient, low-cost way to invest in Canadian large-cap blend stocks. The Fund’s return may not match the return of the underlying index. Growth stocks tend to be more sensitive to changes in their earnings and can be more volatile. Investments focused on a particular sector, such as healthcare, are subject to greater risk, and are more greatly impacted by market volatility than more diversified investments. A value style of investing is subject to the risk that the valuations never improve or that the returns will trail other styles of investing or the overall stock markets. Beta is a measure of risk representing how a security is expected to respond to general market movements.

