XMMO ETF Review
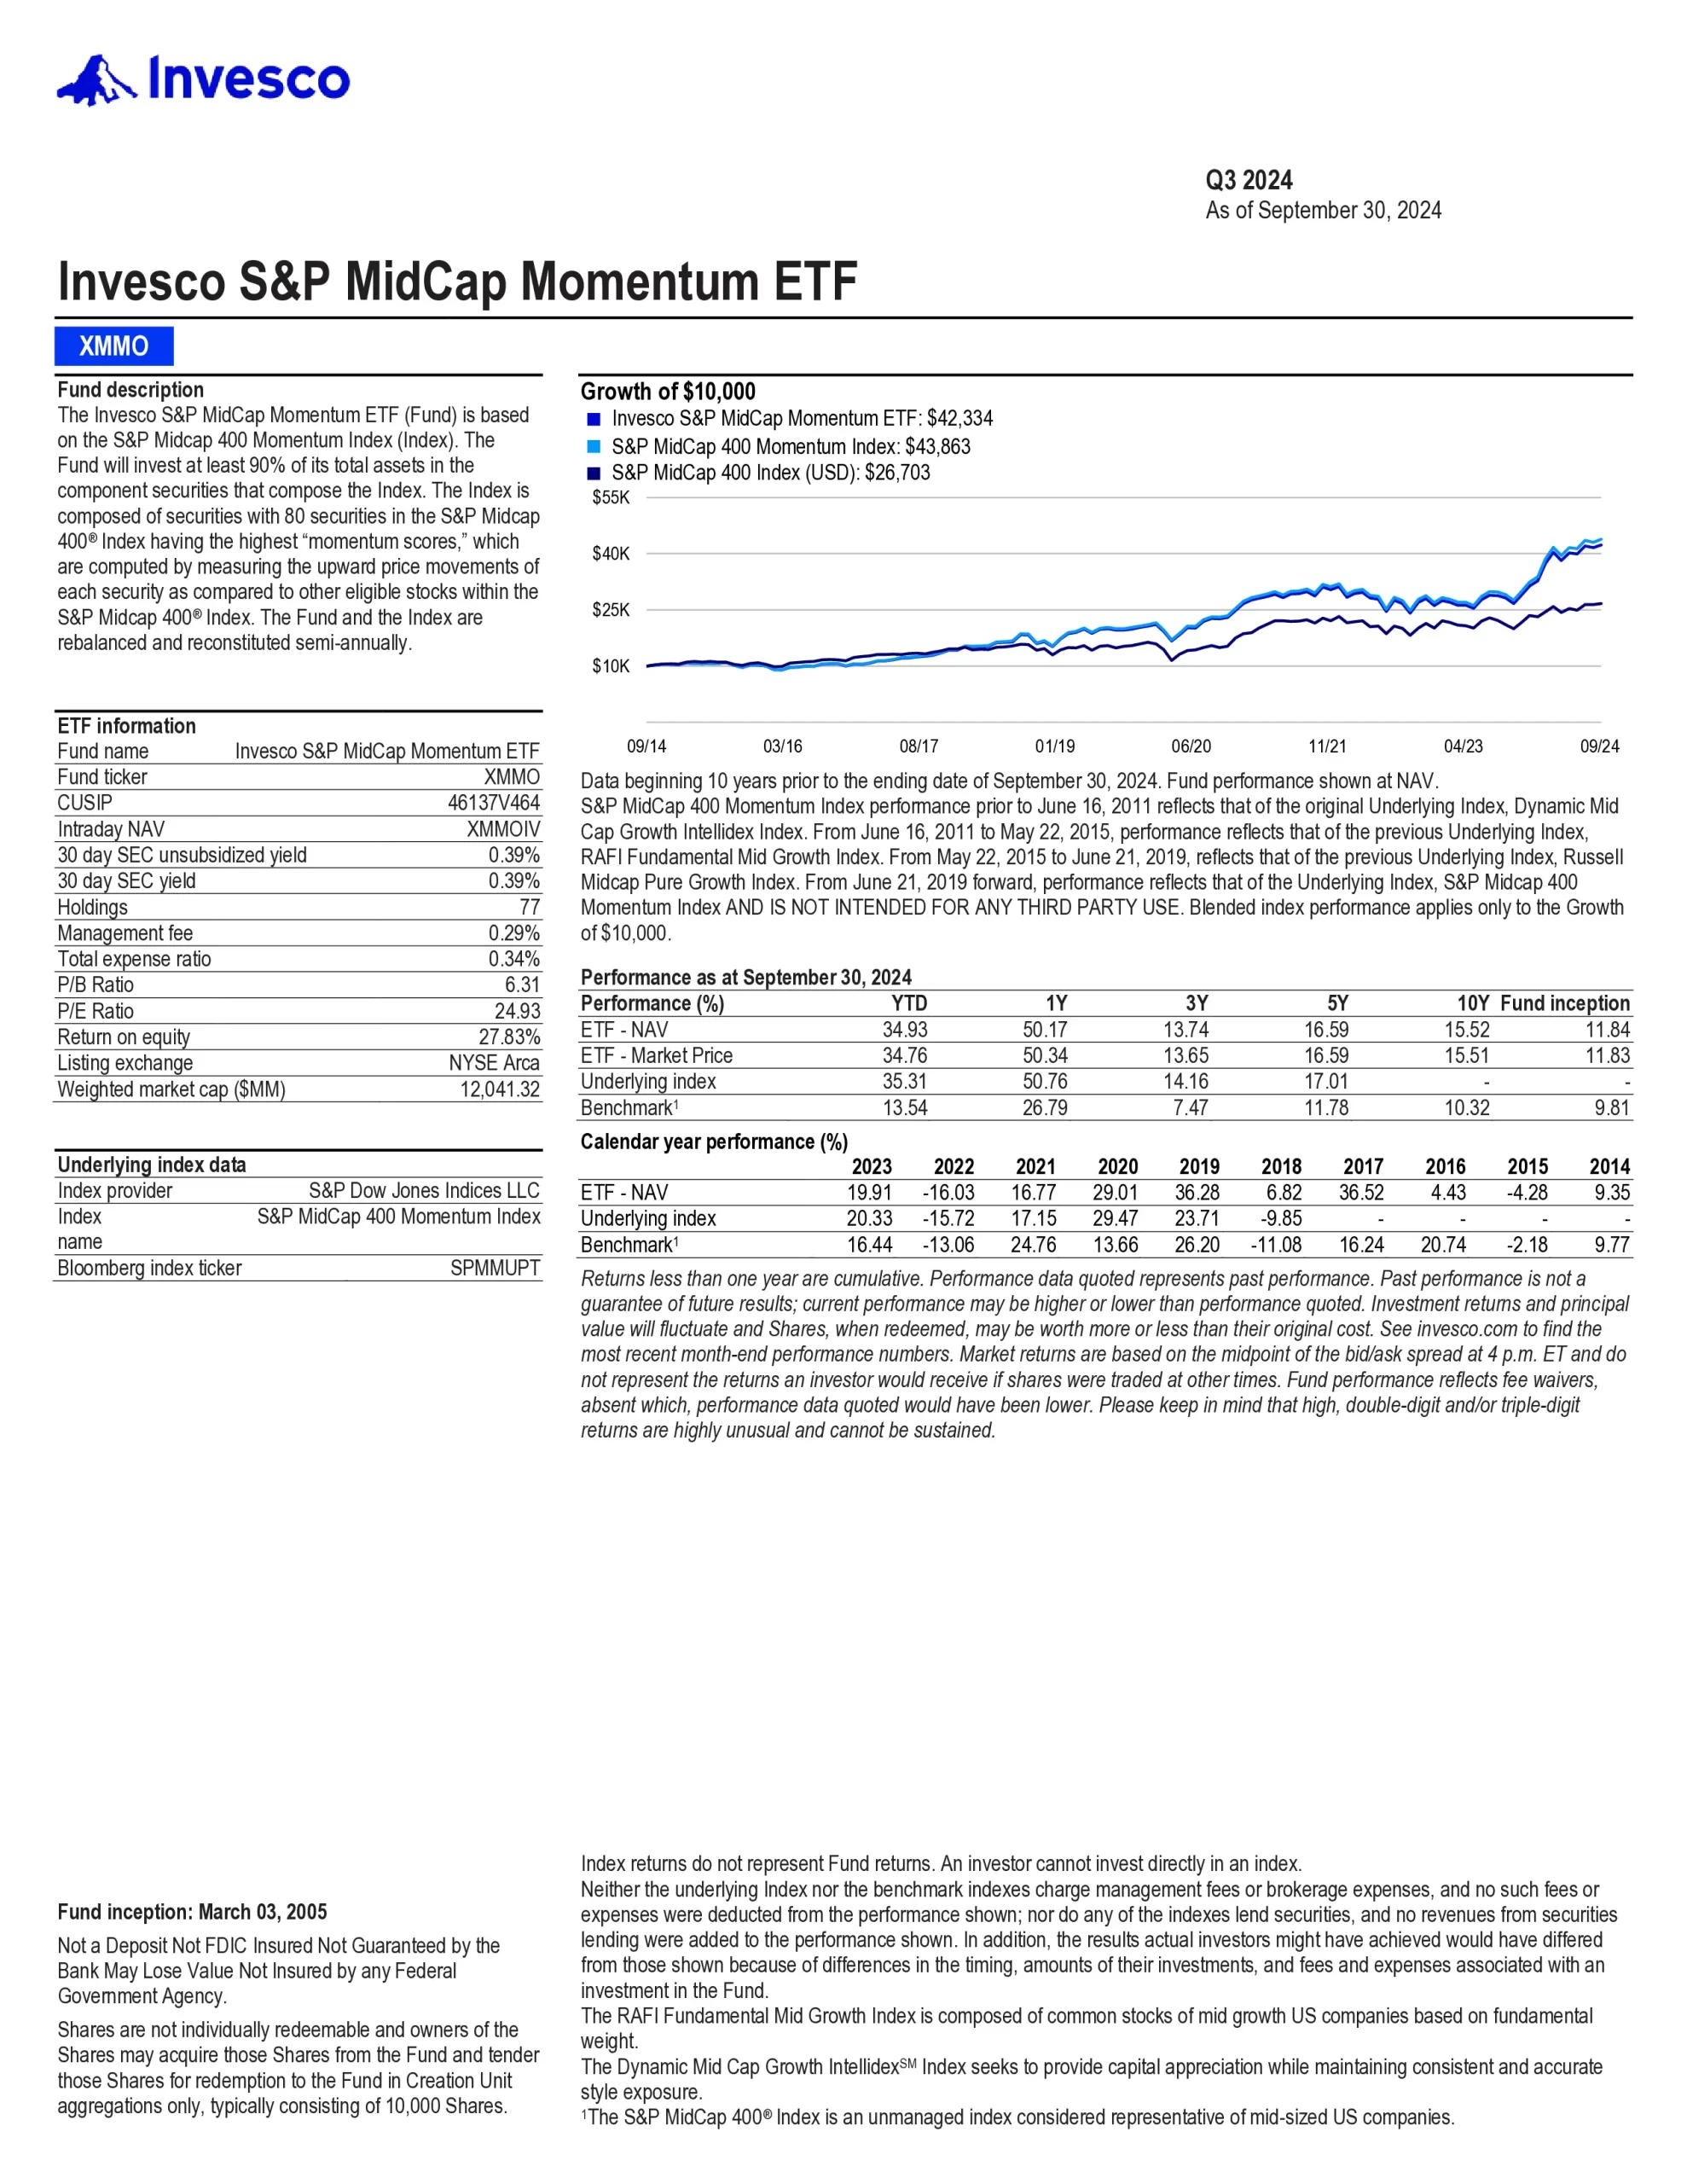
The Invesco S&P MidCap Momentum ETF (XMMO) is based on the S&P Midcap 400 Momentum Index. The Fund will invest at least 90% of its total assets in the component securities that comprise the Index. The Index is composed of securities with 80 securities in the S&P Midcap 400 Index having the highest “momentum scores,” which are computed by measuring the upward price movements of each security as compared to other eligible stocks within the S&P Midcap 400 Index. The Fund and the Index are rebalanced and reconstituted semi-annually.

Top 10 XMMO Holdings
Fund holdings are subject to change.
| Ticker | Name | Weight |
|---|---|---|
| WSM | Williams-Sonoma Inc | 4.05% |
| EME | EMCOR Group Inc | 3.63% |
| SFM | Sprouts Farmers Market Inc | 3.03% |
| LII | Lennox International Inc | 2.74% |
| RGA | Reinsurance Group of America Inc | 2.73% |
| CW | Curtiss-Wright Corp | 2.51% |
| CSL | Carlisle Cos Inc | 2.33% |
| FIX | Comfort Systems USA Inc | 2.33% |
| EVR | Evercore Inc | 2.13% |
| EQH | Equitable Holdings Inc | 2.09% |
Is XMMO a Good ETF?
Quickly compare this ETF to similar funds by fees, performance, yield, and other metrics to decide which investment fits your portfolio.
| ETF | Inception | MER | AUM | Holdings | Beta | P/E | Yield | Distributions | 1Y | 3Y | 5Y | 10Y | 15Y |
|---|---|---|---|---|---|---|---|---|---|---|---|---|---|
| MID | 2020-07-15 | 0.45% | $61,920,232 | N/A | 1.23 | N/A | 0.02% | Quarterly | 13.99% | -1.11% | N/A | N/A | N/A |
| AVMV | 2023-11-07 | 0.20% | $14,851,679 | N/A | N/A | N/A | N/A | Quarterly | N/A | N/A | N/A | N/A | N/A |
| IWR | 2001-07-17 | 0.19% | $31,358,232,767 | 809 | 1.06 | 19.50 | 1.45% | Quarterly | 6.56% | 5.36% | 9.93% | 9.31% | 13.87% |
| SCHM | 2011-01-13 | 0.04% | $10,961,007,150 | 498 | 1.06 | 16.49 | 1.53% | Quarterly | 4.60% | 4.06% | 8.48% | 8.88% | N/A |
| FMDE | 2007-12-20 | 0.23% | $1,440,000,000 | 270 | 1.04 | N/A | 1.04% | Annually | 7.55% | 6.93% | 10.22% | 9.31% | 13.67% |
| FNX | 2007-05-08 | 0.60% | $1,125,905,272 | 450 | 1.10 | 12.73 | 1.14% | Quarterly | 6.12% | 7.39% | 10.63% | 8.74% | 13.85% |
| FLQM | 2017-04-26 | 0.30% | $290,730,000 | 206 | 1.00 | 16.37 | 1.27% | Quarterly | 9.93% | 9.80% | 12.35% | N/A | N/A |
| XMMO | 2005-03-03 | 0.34% | $1,013,900,000 | 78 | 1.09 | 18.17 | 0.77% | Quarterly | 18.99% | 5.76% | 13.71% | 13.39% | 14.80% |
| JPME | 2016-05-11 | 0.24% | $365,680,000 | 362 | 0.98 | 14.33 | 1.87% | Quarterly | 3.00% | 8.32% | 9.56% | N/A | N/A |
| PAMC | 2020-06-24 | 0.60% | $44,941,245 | 124 | 1.02 | 14.73 | 0.68% | Quarterly | 8.32% | 5.37% | N/A | N/A | N/A |
| MDY | 1995-05-04 | 0.23% | $19,547,010,000 | 401 | 1.05 | 14.83 | 1.23% | Quarterly | 4.41% | 6.69% | 9.79% | 9.05% | 13.45% |
| VO | 2004-01-26 | 0.04% | $58,800,000,000 | 329 | 1.05 | 19.14 | 1.54% | Quarterly | 5.89% | 5.19% | 10.15% | 9.51% | 13.91% |
| DON | 2006-06-16 | 0.38% | $3,292,253,640 | 333 | 0.91 | 12.31 | 2.49% | Monthly | 3.24% | 11.01% | 7.83% | 9.10% | 13.74% |
| MIDE | 2021-02-23 | 0.15% | $7,014,878 | 294 | 1.05 | 16.45 | 1.39% | Quarterly | 2.81% | N/A | N/A | N/A | N/A |
Conclusion
There are risks involved with investing in ETFs, including possible loss of money. Ordinary brokerage commissions apply. The Fund’s return may not match the return of the Underlying Index. Growth stocks tend to be more sensitive to changes in their earnings and can be more volatile. Investments focused on a particular sector, such as healthcare, are subject to greater risk, and are more greatly impacted by market volatility than more diversified investments. A value style of investing is subject to the risk that the valuations never improve or that the returns will trail other styles of investing or the overall stock markets. Beta is a measure of risk representing how a security is expected to respond to general market movements.