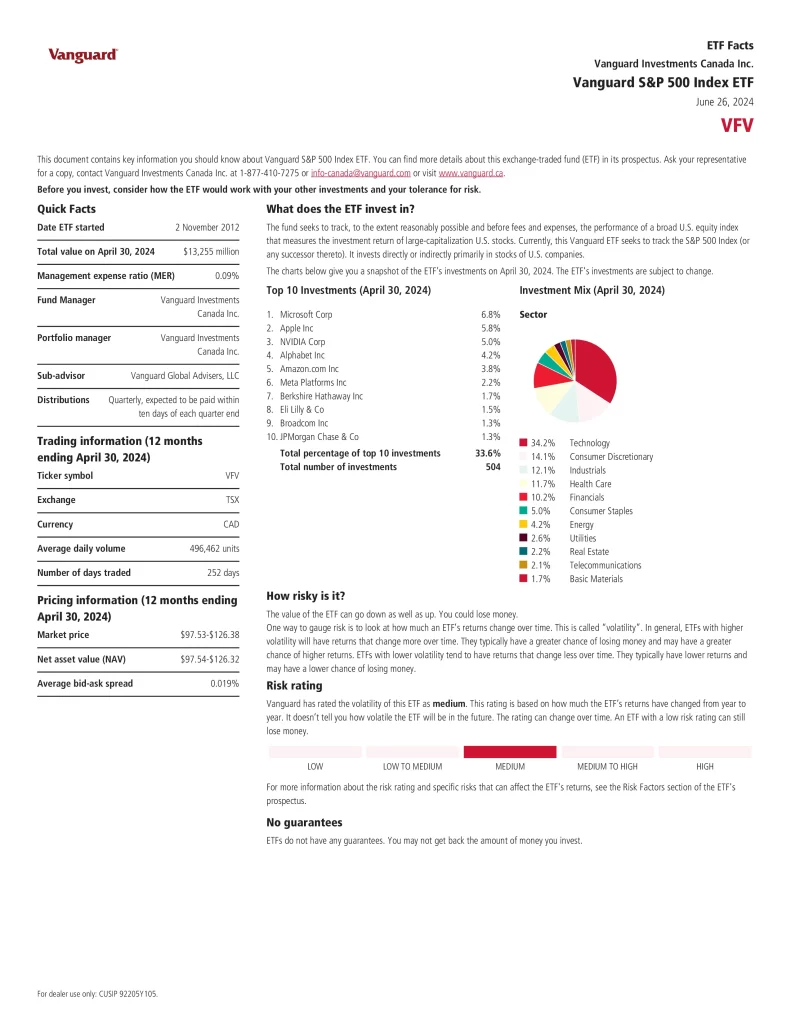
More information about this Exchange Traded Fund (ETF) is in its prospectus. Before investing, assess how the ETF aligns with your portfolio and risk tolerance. Remember that the value of ETFs can fluctuate, meaning you might lose money. They do not offer guarantees, and you may not recover the full amount of your investment. Additionally, purchasing or selling ETF units may incur commission fees, which can vary between brokerage firms. ETF market prices can also experience higher volatility, especially during the opening and closing of trading sessions. Even ETFs rated as low-risk may experience losses under certain market conditions. Always consider these factors carefully when making investment decisions.
XQQ ETF Review
iShares NASDAQ 100 Index ETF (CAD-Hedged) (XQQ) seeks to provide long-term capital growth by replicating the performance of the NASDAQ-100 Currency Hedged CAD Index. Under normal market conditions, the ETF will primarily invest in U.S equity securities. The Index includes 100 of the largest domestic and international non-financial securities listed on The NASDAQ Stock Market based on market capitalization. The ETF will seek to hedge U.S. dollar currency exposure back to Canadian dollars.
- Exposure to 100 of the largest non-financial companies listed on The Nasdaq Stock Market based on market cap
- Can be used to diversify into large-cap U.S. companies while avoiding exposure to financial companies


Top XQQ ETF Holdings
The top 10 holdings account for 50.0% of the total fund which consists of 125 diversified investments.
| Ticker | Name | Weight |
|---|---|---|
| NVDA | NVIDIA Corporation | 8.88% |
| AAPL | Apple Inc. | 8.55% |
| MSFT | Microsoft Corporation | 7.65% |
| AMZN | Amazon.com, Inc. | 5.29% |
| AVGO | Broadcom Inc. | 4.87% |
| META | Meta Platforms Inc | 4.80% |
| TSLA | TESLA INC | 4.12% |
| COST | Costco Wholesale Corporation | 2.62% |
| GOOGL | Alphabet Inc Class A | 2.57% |
| GOOG | Alphabet Inc. Class C | 2.47% |
Is XQQ a Good Investment?
Quickly compare this ETF to other funds by fees, performance, yield, and other metrics to decide which investment fits in your portfolio.
| Manager | ETF | Name | Risk | Inception | AUM | MER | Distributions | Volume | Spread | Holdings |
|---|---|---|---|---|---|---|---|---|---|---|
| BlackRock | XQQ | iShares NASDAQ 100 Index ETF (CAD-Hedged) | Medium to High | 2011-05-03 | $3,156,450,597 | 0.39% | Semi-Annually | 159,030 | 0.03% | 125 |
| BMO | ZQQ | BMO Nasdaq 100 Equity Hedged to CAD Index ETF | Medium to High | 2010-01-19 | $2,132,270,000 | 0.39% | Annually | 131,973 | 0.04% | 100 |
| Global X | QQCC | Global X NASDAQ-100 Covered Call ETF | Medium to High | 2011-09-13 | $242,330,466 | 0.85% | Monthly | 119,677 | 0.13% | 2 |
| Invesco | QQC | Invesco NASDAQ 100 Index ETF | Medium to High | 2021-05-27 | $587,227,305 | 0.20% | Quarterly | 48,936 | 0.13% | 101 |
Conclusion
To assess risk, you can examine an ETF’s volatility, which measures how much its returns fluctuate over time. ETFs with higher volatility typically experience greater swings in returns, increasing both the potential for higher gains and the risk of losses. Conversely, ETFs with lower volatility tend to have more stable returns, often with lower risks and returns. However, even a low-risk ETF can lose value under certain market conditions.
When trading ETFs, it’s essential to understand the bid, ask, and bid-ask spread. The bid represents the highest price a buyer is willing to pay for ETF units, while the ask is the lowest price a seller is willing to accept. The bid-ask spread is the difference between these two prices. A narrower spread generally indicates higher liquidity, meaning you’re more likely to execute trades at expected prices.


