XWD ETF Review
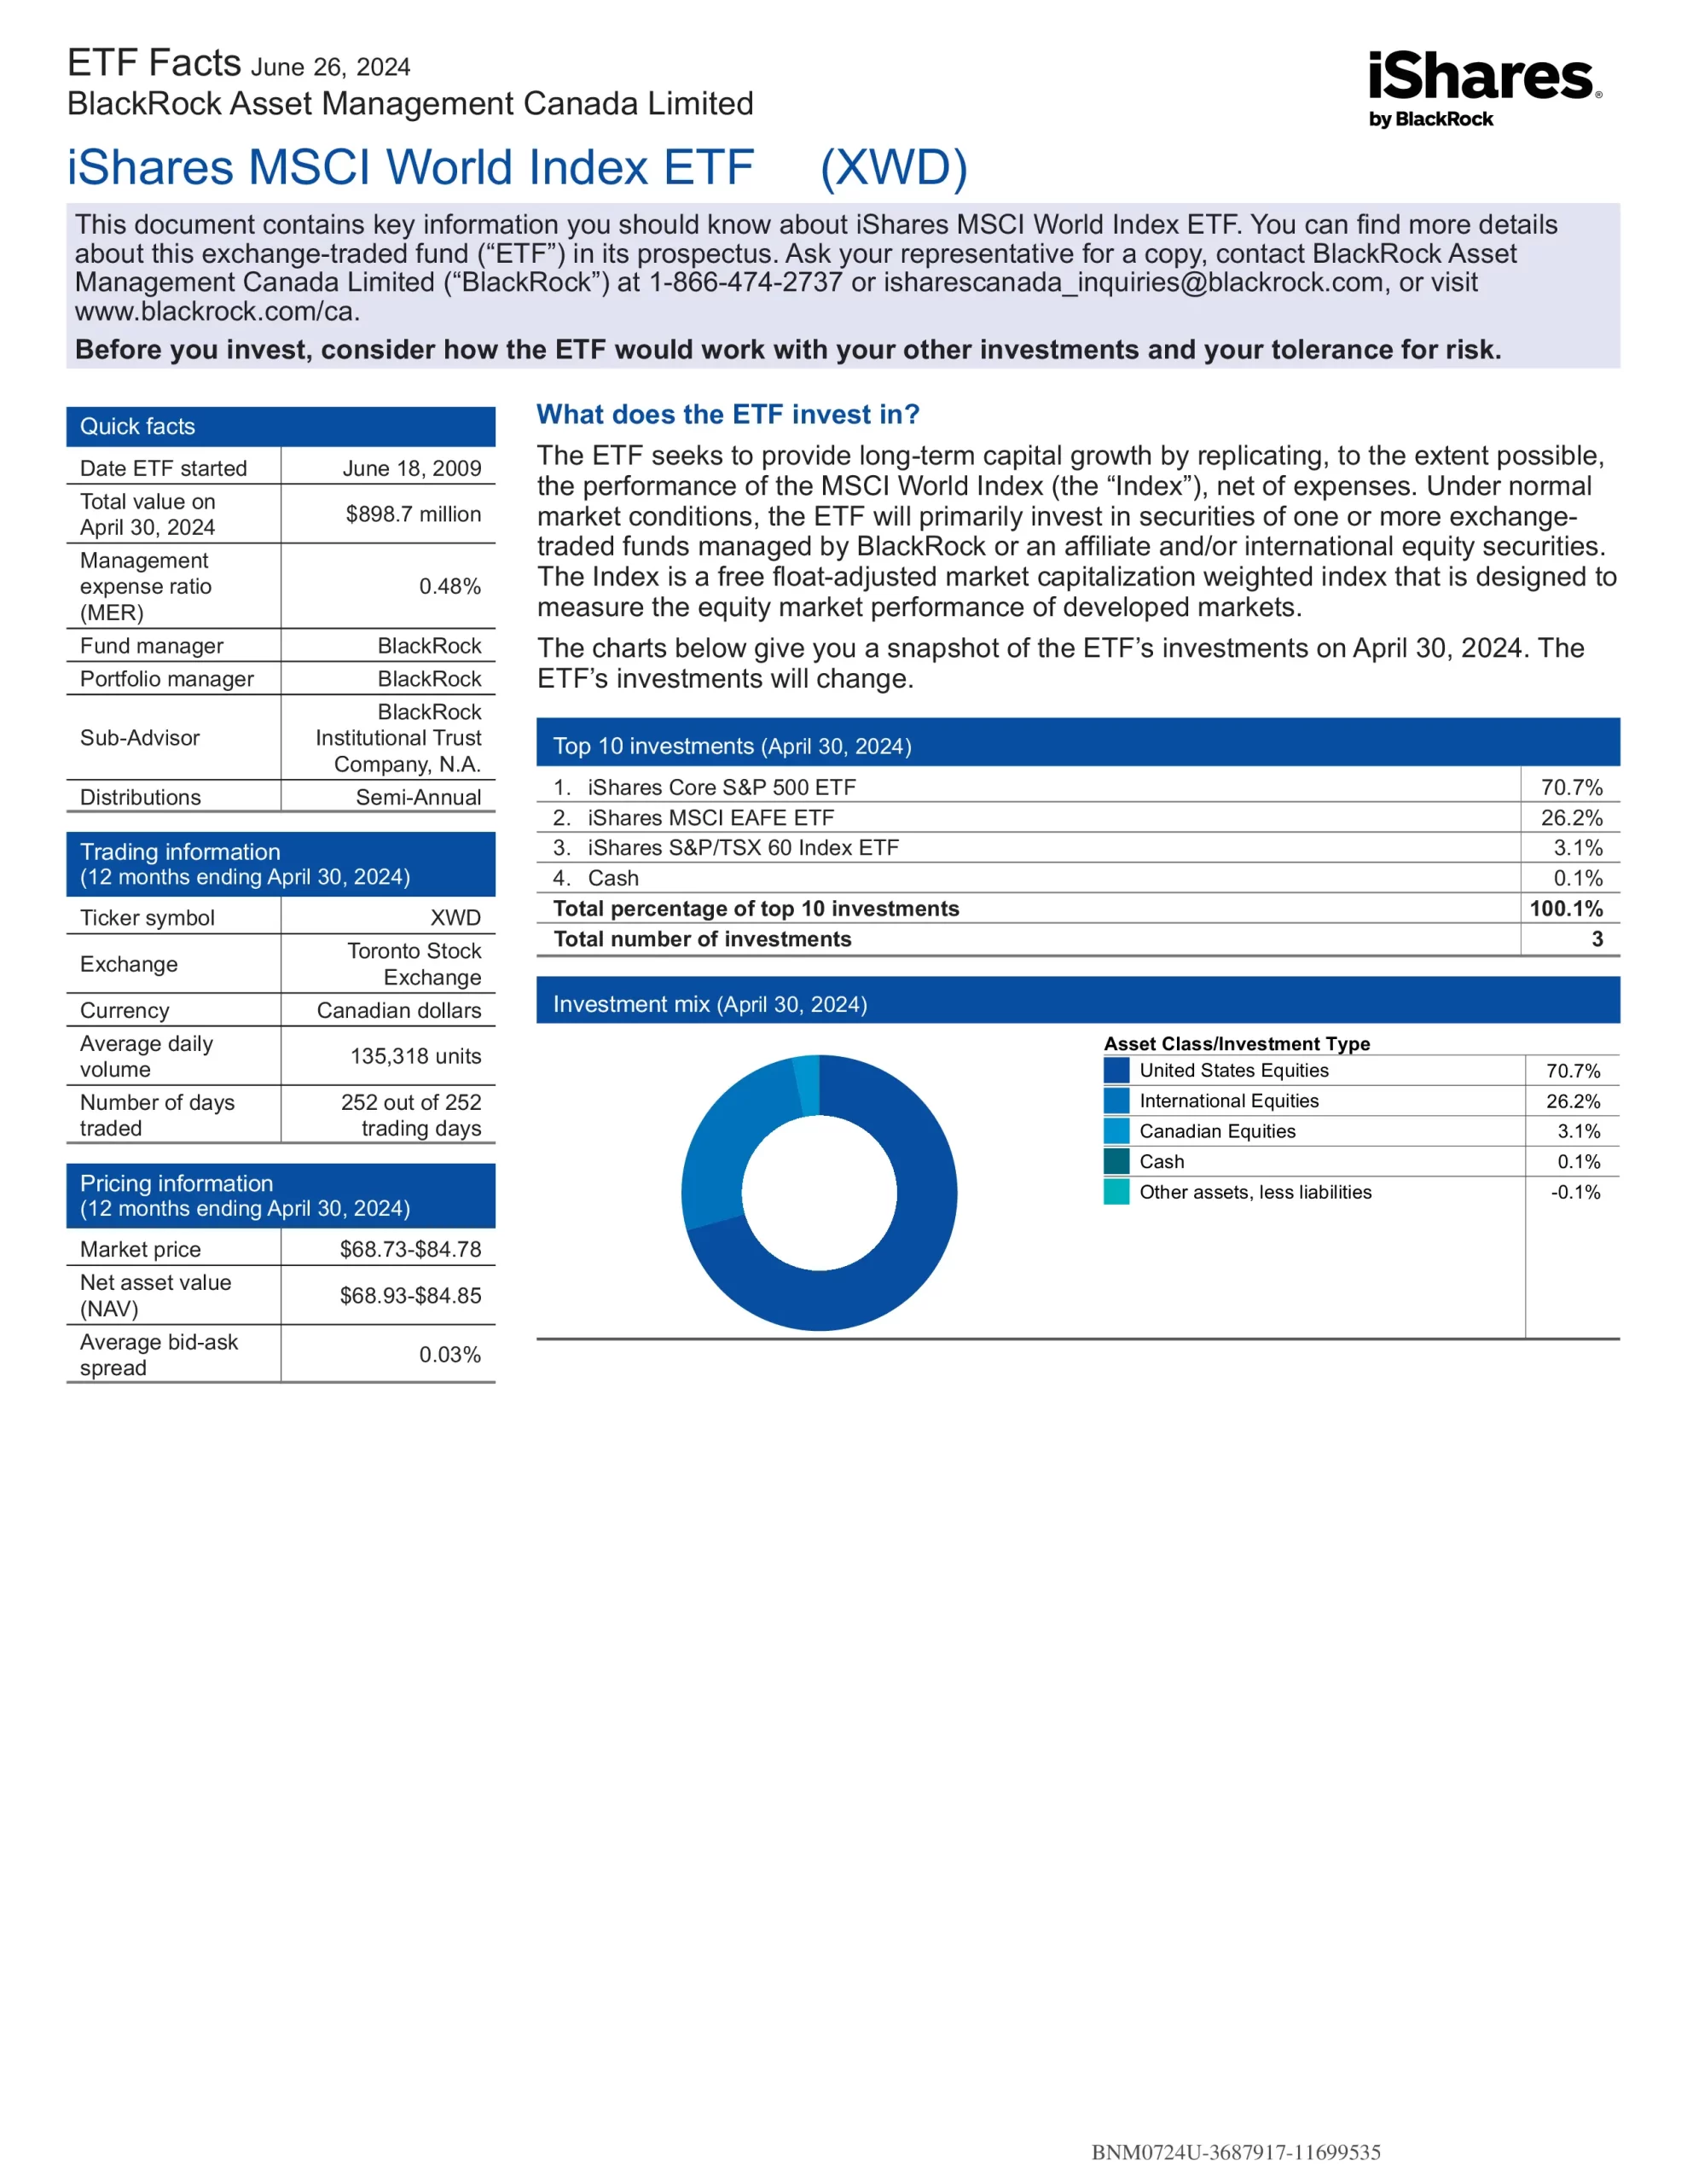
iShares MSCI World Index ETF (XWD) seeks to provide long-term capital growth by replicating, to the extent possible, the performance of the MSCI World Index. Under normal market conditions, the ETF will primarily invest in securities of one or more exchange-traded funds managed by BlackRock or an affiliate and/or international equity securities. The Index is a free float-adjusted market capitalization-weighted index that is designed to measure the equity market performance of developed markets.
- Exposure to sectors that are currently underrepresented in Canada, such as health care, information technology and consumer staples
- Exposure to large and mid-cap equities from developed markets countries around the world
- Can be used to diversify a portfolio comprised of Canadian equities
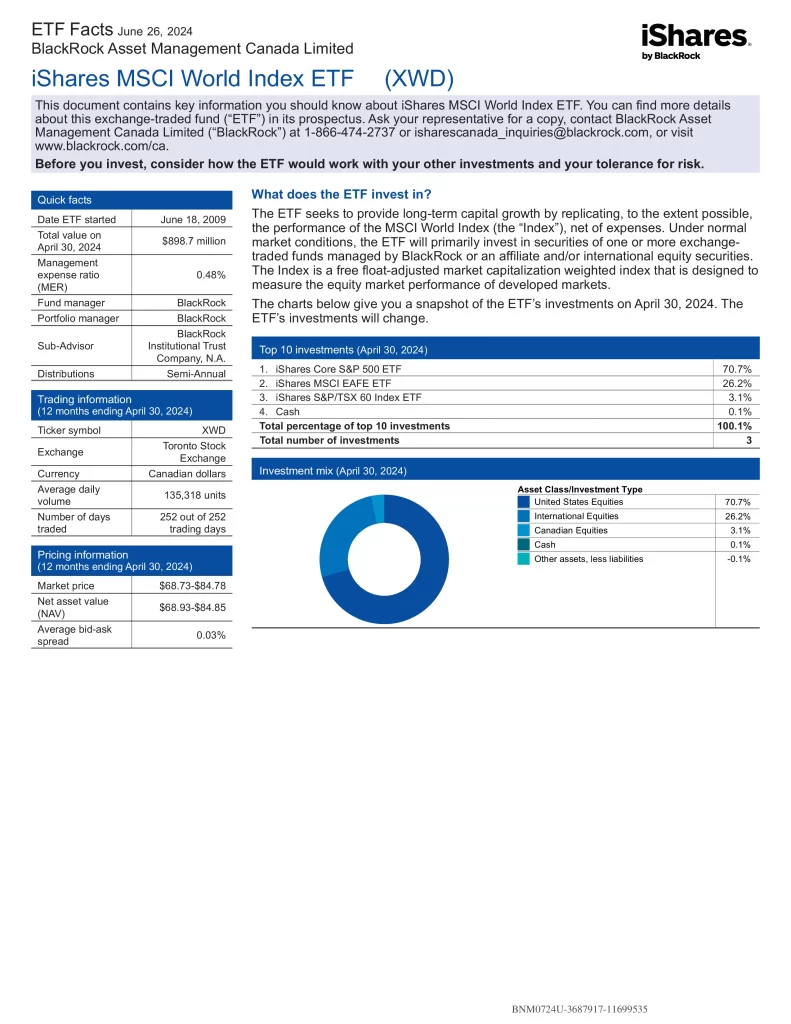
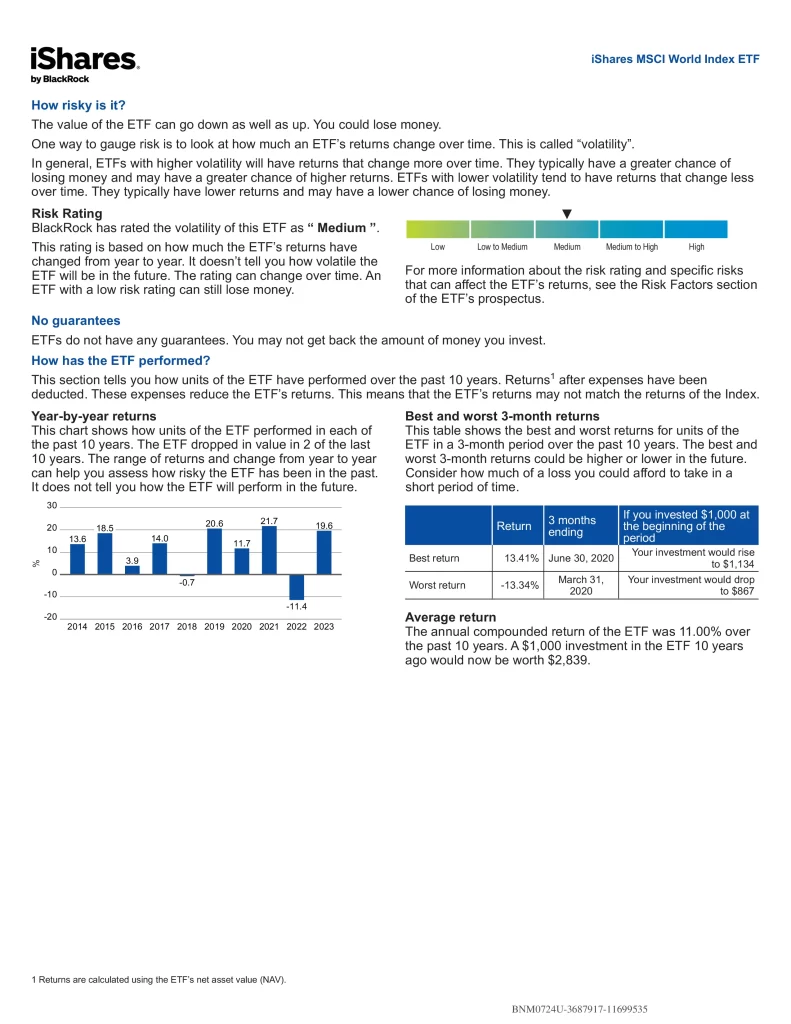
Top 3 XWD Holdings
The top 3 investments of XWD account for 100% of the 3 holdings. This table shows the investment names of the individual holdings that are subject to change.
| Ticker | Name | Weight |
|---|---|---|
| IVV | iShares Core S&P 500 ETF | 71.55% |
| EFA | iShares MSCI EAFE ETF | 25.35% |
| XIU | iShares S&P/TSX 60 Index ETF | 3.03% |
XWD Dividend History
XWD currently has a yield of 1.25% and pays distributions semi-annually.
| Ex-Date | Payable Date | Record Date | Dividend |
|---|---|---|---|
| Jun 25, 2024 | Jun 28, 2024 | Jun 25, 2024 | $0.56500 |
| Dec 28, 2023 | Jan 4, 2024 | Dec 29, 2023 | $0.52615 |
| Jun 26, 2023 | Jun 30, 2023 | Jun 27, 2023 | $0.52900 |
| Dec 29, 2022 | Jan 5, 2023 | Dec 30, 2022 | $1.28188 |
| Jun 24, 2022 | Jun 30, 2022 | Jun 27, 2022 | $0.51400 |
| Dec 30, 2021 | Jan 6, 2022 | Dec 31, 2021 | $0.61258 |
| Jun 24, 2021 | Jun 30, 2021 | Jun 25, 2021 | $0.38300 |
| Dec 30, 2020 | Jan 6, 2021 | Dec 31, 2020 | $0.19649 |
Is XWD a Good Investment?
Quickly compare XWD to similar investments focused on global equity ETFs by risk, fees, performance, yield, volatility, and other metrics to decide which ETF will fit into your portfolio.
| Manager | ETF | Name | Risk | Inception | MER | AUM | Beta | P/E | Yield | Distributions | 1Y | 3Y | 5Y | 10Y | 15Y |
|---|---|---|---|---|---|---|---|---|---|---|---|---|---|---|---|
 | QEF | AGF Systematic Global ESG Factors ETF | Medium | 2018-02-12 | 0.45% | $108,300,000 | 1.01 | 19.42 | 1.87% | Annually | 22.90% | 8.01% | 11.07% | N/A | N/A |
 | XWD | iShares MSCI World Index ETF | Medium | 2009-06-18 | 0.48% | $1,023,765,035 | 1.05 | 22.81 | 1.25% | Semi-Annually | 23.76% | 10.77% | 12.59% | 11.65% | 11.94% |
 | ZWQT | BMO Global Enhanced Income Fund Series ETF | Medium | 2023-06-19 | 0.71% | $10,310,000 | N/A | N/A | N/A | Monthly | 15.76% | N/A | N/A | N/A | N/A |
 | BMAX | Brompton Enhanced Multi-Asset Income ETF | Medium | 2022-10-18 | 2.85% | $77,000,000 | N/A | N/A | 9.10% | Monthly | 19.81% | N/A | N/A | N/A | N/A |
| CEQT | CI Equity Asset Allocation ETF | Medium | 2023-05-17 | N/A | $5,800,000 | N/A | N/A | N/A | Quarterly | 15.25% | N/A | N/A | N/A | N/A | |
 | FEQT | Fidelity All-in-One Equity ETF | Medium | 2022-01-25 | 0.43% | $369,800,000 | N/A | N/A | 1.17% | Annually | 24.41% | N/A | N/A | N/A | N/A |
 | EQCC | Global X All-Equity Asset Allocation Covered Call ETF | Medium | 2024-05-28 | N/A | $2,005,753 | N/A | N/A | N/A | Monthly | N/A | N/A | N/A | N/A | N/A |
 | HYLD | Hamilton Enhanced U.S. Covered Call ETF | Medium | 2022-02-07 | 2.40% | $576,200,000 | N/A | 21.78 | 11.51% | Monthly | 22.47% | N/A | N/A | N/A | N/A |
 | HDIF | Harvest Diversified Monthly Income ETF | Medium | 2022-02-11 | 2.37% | $371,920,000 | N/A | 16.67 | 10.42% | Monthly | 14.93% | N/A | N/A | N/A | N/A |
 | PDIV | Purpose Enhanced Dividend Fund ETF | Low to Medium | 2013-02-20 | 0.78% | $57,800,000 | 0.56 | 12.07 | 12.28% | Monthly | 4.39% | 3.05% | 5.70% | 4.59% | N/A |
 | VEQT | Vanguard All-Equity ETF Portfolio | Medium | 2019-01-29 | 0.24% | $4,290,000,000 | 0.96 | 17.41 | 1.71% | Annually | 19.09% | 7.45% | 10.63% | N/A | N/A |
XWD vs XAW
XWD is the better ETF. Both funds have semi-annual dividend distributions and global diversification, but XAW excludes Canada. XWD is the better performing ETF than XAW which is more popular, less expensive and higher-yielding.
XWD vs XEQT
XWD is the better ETF. Both funds have global diversification. XWD is the better performing ETF than XEQT which is more popular, less expensive, higher-yielding and more frequent distributions.
XWD vs URTH
XWD is the better ETF. Both funds have semi-annual dividend distributions and global diversification. XWD is the better performing ETF than URTH which is more popular, less expensive, higher-yielding and more frequent distributions.
XWD vs VXC
XWD is the better ETF. Both funds have global diversification, but VXC excludes Canada. XWD is the better performing ETF than VXC which is more popular, less expensive, distributes dividends quarterly and higher-yielding .
XWD vs Bank Mutual Funds
| Ticker | Name | MER | 1Y | 3Y | 5Y | 10Y | 15Y |
|---|---|---|---|---|---|---|---|
| BMO485 | BMO SelectTrust Equity Growth Portfolio | 2.61% | 17.77% | 6.13% | 8.00% | 7.47% | N/A |
| MAX1274 | Canada Life Aggressive Portfolio | 2.47% | 14.37% | 5.23% | 7.85% | 5.88% | 7.25% |
| CIB250 | CIBC Smart Growth Solution | 1.93% | 14.76% | 4.32% | 6.77% | N/A | N/A |
| XWD | iShares MSCI World Index ETF | 0.48% | 23.76% | 10.77% | 12.59% | 11.65% | 11.94% |
| NBC926 | NBI Equity Portfolio | 2.51% | 14.88% | 5.58% | 9.12% | N/A | N/A |
| NWT90012 | NEI Select Maximum Growth RS Portfolio | 2.45% | 15.02% | 3.51% | 6.83% | 7.22% | N/A |
| RBF592 | RBC Select Aggressive Growth Portfolio | 2.14% | 17.58% | 5.56% | 8.76% | 8.08% | 8.65% |
| BNS344 | Scotia Selected Maximum Growth Portfolio | 2.16% | 11.75% | 2.91% | 7.58% | 7.14% | 7.94% |
| TDB889 | TD Comfort Aggressive Growth Portfolio | 2.23% | 15.62% | 7.19% | 7.87% | 6.51% | 7.88% |

