What is the Best American bond ETF in Canada?
- CINC.TO: CI DoubleLine Income US$ Fund
- DXO.TO: Dynamic Active Crossover Bond ETF
- HUF.TO: Horizons Active Ultra-Short Term US Investment Grade Bond ETF
- PFL.TO: Invesco 1-3 Year Laddered Floating Rate Note Index ETF
- QTIP.NE: Mackenzie US TIPS Index ETF (CAD-Hedged)
- TUHY
- TUSB
- VBU.NE: Vanguard U.S. Aggregate Bond Index ETF (CAD-hedged)
- XAGG.TO: iShares U.S. Aggregate Bond Index ETF
- XAGH.TO: iShares U.S. Aggregate Bond Index ETF
- XCBU.TO: iShares U.S. IG Corporate Bond Index ETF
- XHY.TO: iShares U.S. High Yield Bond Index ETF (CAD-Hedged)
- XIG.TO: iShares U.S. IG Corporate Bond Index ETF (CAD-Hedged)
- XIGS.TO: iShares 1-5 Year U.S. IG Corporate Bond Index ETF
- XSHU.TO: iShares 1-5 Year U.S. IG Corporate Bond Index ETF
- XSTH.TO: iShares 0-5 Year TIPS Bond Index ETF
- XSTP.TO: iShares 0-5 Year TIPS Bond Index ETF
- XTLH.TO: iShares 20+ Year U.S. Treasury Bond Index CAD Hdg ETF
- XTLT.TO: iShares 20+ Year U.S. Treasury Bond Index ETF
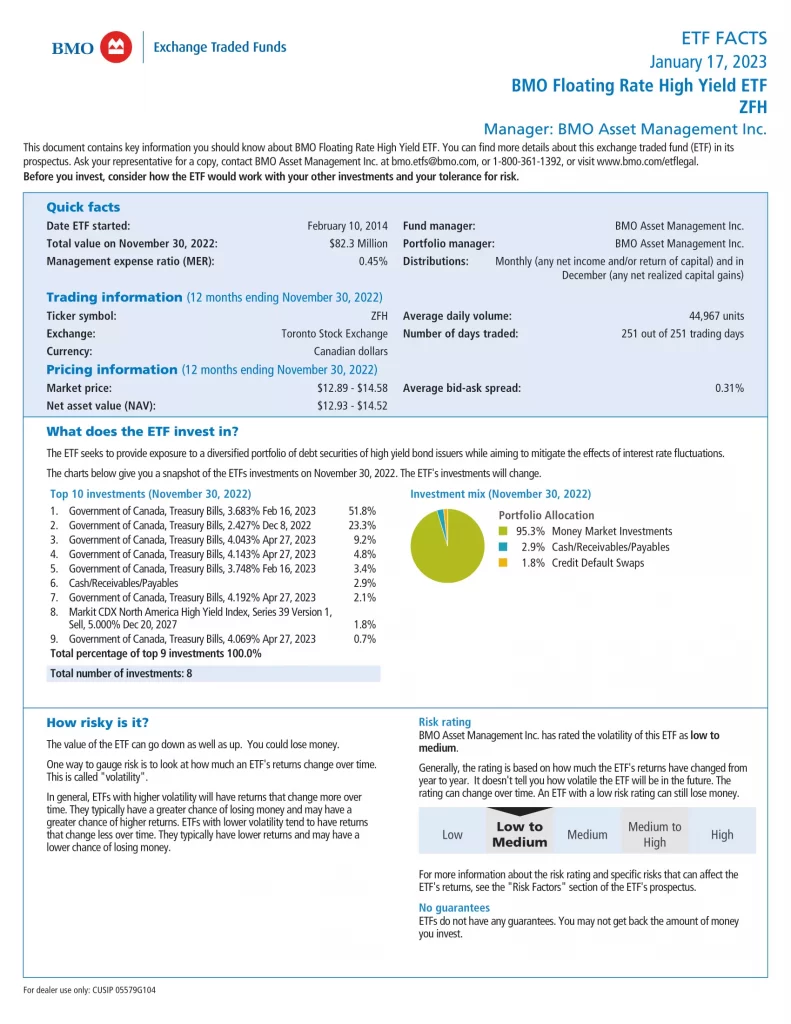
- ZFH.TO: BMO Floating Rate High Yield ETF
- ZIC.TO: BMO Mid-Term US IG Corporate Bond Index ETF
Here is a table comparing ZFH to similar American bond ETFs in Canada as of November 30, 2023.
| Manager |  |  |  |  |  |  |  |  |  |
| ETF | XHY | XSTP | ZFH | ZIC | DXO | HUF | PFH.F | QTIP | TUHY |
| Inception | 2010-01-21 | 2021-07-06 | 2014-02-10 | 2013-03-19 | 2017-01-20 | 2013-09-13 | 2011-06-08 | 2018-01-24 | 2019-11-19 |
| MER | 0.66% | 0.16% | 0.45% | 0.28% | 0.56% | 0.47% | 0.55% | 0.17% | 0.62% |
| AUM | $399,538,508 | $66,509,384 | $74,270,000 | $2,901,250,000 | $52,450,000 | $14,578,902 | $155,284,643 | $395,756,418 | $27,700,000 |
| Duration | 3.38 | 2.46 | N/A | N/A | N/A | N/A | N/A | 6.83 | 4.99 |
| Coupon | 5.94% | 5.34% | N/A | N/A | N/A | N/A | N/A | 4.65% | 5.2% |
| Yield | 5.81% | 2.87% | 8.77% | 3.90% | 7.17% | 4.65 % | N/A | 4.78% | 6.12% |
| Distributions | Monthly | Monthly | Monthly | Monthly | Monthly | Monthly | Monthly | Monthly | Monthly |
| 1Y | 6.27% | 3.12% | 10.22% | 4.89% | 7.19% | 7.20% | 5.51% | 0.1% | 6.27% |
| 3Y | 0.08% | N/A | 5.05% | -2.52% | 0.36% | 3.67% | 0.49% | -2.0% | 0.33% |
| 5Y | 2.32% | N/A | 3.97% | 2.66% | 4.44% | 3.29% | 2.73% | 2.1% | N/A |
| 10Y | 2.63% | N/A | N/A | 5.02% | N/A | 4.71% | 2.91% | N/A | N/A |


