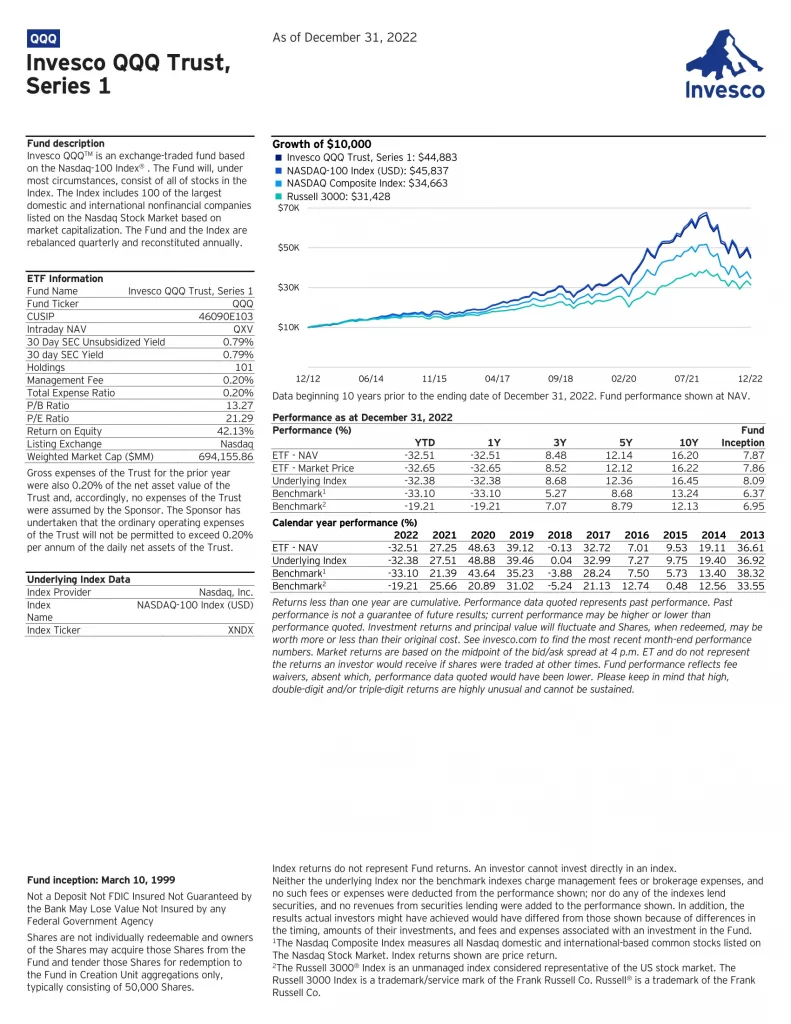
Invesco QQQ Trust (QQQ) gives you access to a diverse group of cutting-edge Nasdaq-100 companies all in one fund. Invesco QQQ has delivered strong, consistent returns by investing in the innovators of today and tomorrow. QQQ provides exposure to companies at the forefront of innovation across a diverse range of sectors, all in one investment.
QQQ ETF Review
Since its formation in 1999, QQQ has demonstrated a history of outperformance, typically beating the S&P 500 Index. QQQ is highly liquid because it is one of the most actively traded securities. The Nasdaq-100 index includes many of the world’s leading technology stocks, as well as the companies at the forefront of many long-term innovative themes shaping today’s economy. Some investors use ETFs to gain exposure to broad ranges of companies rather than picking individual stocks, which reduces single-stock risk. QQQ provides diversified exposure to many innovative companies, including leaders in software, hardware, e-commerce, social media, biotechnology and other areas.
| Manager | Invesco |
| Ticker | QQQ |
| Risk | N/A |
| Inception | 1999-03-10 |
| MER | 0.20% |
| AUM | $259,270,000,000 |
| Holdings | 101 |
| Beta | 1.18 |
| P/E | 36.21 |
| Dividend | $0.57345 |
| Yield | 0.58% |
| Distributions | Quarterly |
TOP 10 QQQ Holdings
QQQ invests in a technology sector heavy portfolio. Here is a list of the top 10 underlying holdings held in QQQ as of June 3, 2023.
| Ticker | Name | Weight |
|---|---|---|
| MSFT | Microsoft Corporation | 8.74% |
| AAPL | Apple Inc. | 7.40% |
| NVDA | NVIDIA Corporation | 6.31% |
| AMZN | Amazon.com, Inc. | 5.24% |
| META | Meta Platforms Inc | 4.75% |
| AVGO | Broadcom Inc. | 4.43% |
| GOOGL | Alphabet Inc Class A | 2.49% |
| GOOG | Alphabet Inc. Class C | 2.41% |
| TSLA | Tesla Inc | 2.37% |
| COST | Costco Wholesale Corporation | 2.35% |
QQQ Performance
Quickly compare and contrast QQQ to other investments focused on US large cap equities by fees, performance, yield, and other metrics to decide which ETF fits in your portfolio.
| Manager | ETF | Inception | MER | AUM | P/E | Yield | Distributions | 1Y | 3Y | 5Y | 10Y | 15Y |
|---|---|---|---|---|---|---|---|---|---|---|---|---|
 | SPDV | 2017-11-28 | 0.29% | $62,489,748 | 12.94 | 3.95% | Monthly | 5.61% | 6.50% | 6.77% | N/A | N/A |
 | LRGC | 2023-09-19 | N/A | $73,520,000 | N/A | N/A | Annually | N/A | N/A | N/A | N/A | N/A |
 | QGRO | 2018-09-10 | 0.29% | $879,726,671 | 32.59 | 0.39% | Quarterly | 26.43% | 8.59% | 16.45% | N/A | N/A |
 | DIVO | 2016-12-14 | 0.55% | $2,905,158,096 | 15.74 | 4.57% | Monthly | 13.05% | 10.16% | 11.69% | N/A | N/A |
 | AVUS | 2019-09-24 | 0.15% | $6,094,210,827 | 17.04 | 1.40% | Quarterly | 14.35% | 10.52% | N/A | N/A | N/A |
 | IVW | 2000-05-22 | 0.18% | $38,186,669,302 | 27.74 | 0.93% | Quarterly | 38.34% | 10.18% | 15.71% | 14.04% | 16.91% |
 | CGGR | 2022-02-22 | 0.39% | $4,642,000,000 | 28.64 | 0.40% | Semi-Annually | 30.39% | N/A | N/A | N/A | N/A |
 | SCHX | 2009-11-03 | 0.03% | $38,141,469,714 | 25.06 | 1.37% | Quarterly | 20.80% | 9.87% | 14.06% | 12.39% | N/A |
 | ESGS | 2016-06-13 | 0.35% | $6,514,616 | 18.95 | 2.32% | Quarterly | 15.75% | 13.00% | 12.26% | N/A | N/A |
 | JEPY | 2023-09-18 | 0.99% | $129,540,000 | N/A | N/A | Monthly | N/A | N/A | N/A | N/A | N/A |
 | DFAC | 2021-06-14 | 0.17% | $26,400,000,000 | 19.18 | 1.14% | Quarterly | 22.79% | 9.87% | 13.03% | 10.72% | 15.58% |
 | FVAL | 2016-09-12 | 0.15% | $698,290,000 | 14.82 | 1.69% | Quarterly | 15.75% | 11.26% | 12.39% | N/A | N/A |
 | FTHI | 2014-01-06 | 0.75% | $539,790,667 | 18.80 | 8.36% | Monthly | 21.01% | 10.61% | 6.87% | 6.72% | N/A |
 | ESG | 2016-07-13 | 0.32% | $199,340,000 | 24.12 | 1.09% | Quarterly | 21.31% | 10.29% | 14.54% | N/A | N/A |
 | LRGE | 2017-05-22 | 0.59% | $206,650,000 | 46.59 | N/A | N/A | 37.95% | 9.27% | 16.00% | N/A | N/A |
 | AUSF | 2018-08-24 | 0.27% | $222,150,000 | 20.96 | 1.80% | Semi-Annually | 33.28% | 15.92% | 13.31% | N/A | N/A |
 | JUST | 2018-06-07 | 0.20% | $331,530,000 | 24.68 | 1.34% | Quarterly | 20.12% | 10.33% | 14.08% | N/A | N/A |
 | QQQ | 1999-03-10 | 0.20% | $259,270,000,000 | 36.18 | 0.58% | Quarterly | 50.74% | 12.49% | 21.31% | 18.14% | 21.36% |
 | JEPI | 2020-05-20 | 0.35% | $33,000,000,000 | 24.98 | 7.85% | Monthly | 15.02% | 10.62% | N/A | N/A | N/A |
 | OUSA | 2015-07-14 | 0.48% | $736,478,089 | 24.16 | 1.78% | Quarterly | 13.26% | 10.03% | 10.50% | N/A | N/A |
 | COWZ | 2016-12-16 | 0.49% | $19,893,341,895 | 8.47 | 1.93% | Quarterly | 15.72% | 16.62% | 15.42% | N/A | N/A |
 | NOBL | 2013-10-09 | 0.35% | $11,760,000,000 | N/A | 2.05% | Quarterly | 9.55% | 8.72% | 10.14% | 10.50% | N/A |
 | DIA | 1998-01-13 | 0.16% | $34,227,230,000 | 23.25 | 1.74% | Monthly | 21.81% | 10.08% | 10.70% | 11.46% | 14.63% |
 | STXG | 2022-11-09 | 0.18% | $52,710,000 | 35.79 | 0.54% | Quarterly | 29.22% | N/A | N/A | N/A | N/A |
 | TEQI | 2020-08-04 | 0.54% | $144,600,000 | N/A | 2.12% | Quarterly | 4.15% | 10.37% | N/A | N/A | N/A |
 | MOAT | 2012-04-24 | 0.46% | $12,040,000,000 | 27.48 | 0.87% | Annually | 15.75% | 11.80% | 14.46% | 12.98% | N/A |
 | MGK | 2007-12-17 | 0.07% | $13,700,000,000 | 42.03 | 0.49% | Quarterly | 40.43% | 10.27% | 18.76% | 15.43% | 17.02% |
 | DGRW | 2013-05-22 | 0.28% | $11,953,527,700 | 24.49 | 1.72% | Monthly | 16.21% | 12.52% | 14.21% | 12.72% | N/A |
 | JOET | 2020-11-17 | 0.29% | $89,927,599 | 19.32 | 1.30% | Quarterly | 12.38% | 7.97% | N/A | N/A | N/A |
QQQ vs QQQM
QQQM is the better ETF. QQQM is the superior performing, less expensive, more diversified ETF than QQQ which is older, more popular, higher yielding and has similar volatility.
QQQ vs SPY
QQQ is the better ETF. QQQ is the superior performing ETF than SPY which is older, less expensive, more popular, higher yielding, more diversified and has similar volatility.
QQQ vs VOO
QQQ is the better ETF. QQQ is the superior performing and older ETF than VOO which is more popular, less expensive, higher yielding, more diversified and less volatile.
QQQ vs VGT
VGT is the better ETF. VGT is the superior performing, higher yielding and less expensive ETF than QQQ which is more popular, less expensive, more diversified and less volatile.
QQQ vs VTI
QQQ is the better ETF. QQQ is the superior performing and older ETF than VTI which is more popular, less expensive, higher yielding, more diversified and less volatile.
QQQ vs VUG
QQQ is the better ETF. QQQ is the superior performing, more popular and older ETF than VUG which is less expensive, higher yielding, more diversified and less volatile.
QQQ vs TQQQ
TQQQ is the better ETF. Both funds have similar yield and diversification. TQQQ is the superior performing ETF than QQQ which is older, more popular, less expensive and less volatile.
QQQ vs IVV
QQQ is the better ETF. QQQ is the superior performing and older ETF than IVV which is more popular, less expensive, higher yielding, more diversified and less volatile.
What is the Difference Between the S&P 500 and QQQ?
QQQ tracks the Nasdaq 100 index which includes the most actively traded non-finance stocks and the S&P 500 index tracks the top stocks listed in the US market, by market capitalization.
Conclusion
I consider Vanguard Information Technology Index Fund (VGT) to be the best of the compared ETFs and highly recommend diversifying your portfolio further than just this recommendation. QQQ is cost efficient fund that invests in NASDAQ exchange corporations that have historically outperformed the S&P 500 index offering excellent long-term growth with increased volatility. It holds the world’s leading technology stocks, as well as long-term leading innovative companies in software, hardware, e-commerce, social media, biotechnology, and other areas. TQQQ is a leveraged option with added risks.


