
Trying to decide which ETFs to buy that invest in a balanced (60/40) asset allocation?
Read my latest Canadian mutual fund review to help you with your portfolio construction.
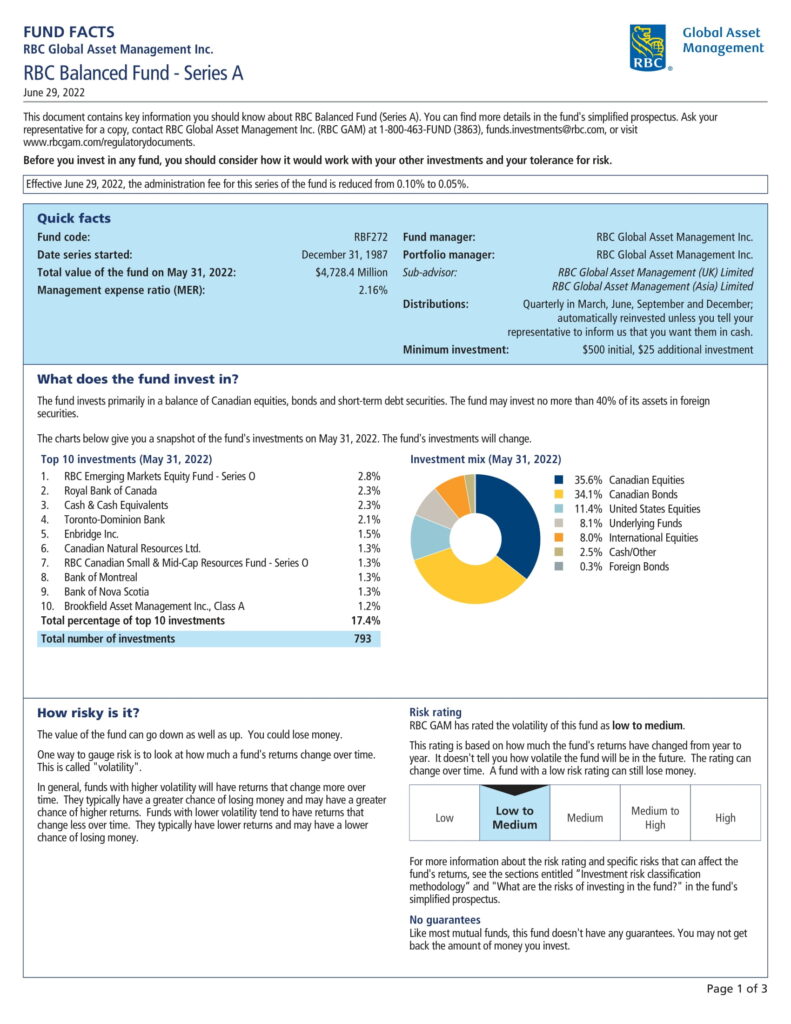
RBC Balanced Fund vs. XBAL
Here is a table comparing RBC Balanced Fund to iShares Core Balanced ETF Portfolio (XBAL.TO) as of January 31, 2023. These are both 60% equity / 40% fixed income portfolios that are well diversified.
| Investment | RBC Balanced Fund | iShares Core Balanced ETF Portfolio |
| Fund Code | RBF272 | XBAL.TO |
| Inception | 1987-12-31 | 2007-06-21 |
| AUM | $4,333,200,000 | $917,297,883 |
| MER | 2.16% | 0.20% |
| Risk | Low to Medium | Low to Medium |
| Yield | N/A | 1.90% |
| Distributions | Quarterly | Quarterly |
| 1MO | 5.0% | 4.92% |
| 3MO | 6.7% | 7.00% |
| YTD | 5.0% | 4.92% |
| 1 YR | -4.0% | -3.49% |
| 3 YR | 3.6% | 4.15% |
| 5 YR | 4.1% | 5.29% |
| 10 YR | 5.1% | 5.17% |
| P/E | 13.3 | 13.89 |
| P/B | 1.8 | 1.95 |
| Beta | N/A | 1.18 |
- AUM – Assets Under Management
- Beta – the measure of the volatility of a stock compared to the market
- C/S: Cash per Share – the percentage of a company’s share price available to spend on growing the corporation
- Current: Current Ratio – a liquidity ratio that measures a company’s ability to pay short-term obligations or those due within one year
- Distributions – Dividend Distributions
- Dividend Date – the date that a company announces it is paying a dividend
- Earnings: Earnings Date – the next release of a company’s financial report
- ETF – Exchange Traded Fund
- EV/EBITDA: Enterprise Value to Earnings Before Interest, Taxes, Depreciation, and Amortization – this ratio compares the value of a company, including debt, to the company’s cash earnings less non-cash expenses
- Ex-Dividend: Ex-Dividend Date – the dividend will be received if bought at least one day before this date
- Holdings: Number of Holdings – the total number of different holdings of a fund
- Inception: Inception Date – the date of the first subscription for units of the fund
- Industry: companies that have a lot in common
- Margin (%): Gross Margin – the percentage of money a corporation has left after subtracting all direct costs of producing or purchasing the goods or services it sells
- Market Cap: Market Capitalization – the total value of all a corporation’s stock
- N/A: Not Applicable or Not Available
- P/B: Price-to-Book – this ratio measures the market’s valuation of a company relative to its book value
- P/E: Price-to-Earnings – this ratio relates a corporation’s share price to its earnings per share
- ROIC (%): Return on Invested Capital – assess a corporation’s efficiency in allocating capital to profitable investments
- Manager – Fund or Portfolio Manager
- Margin (%): Gross Margin – the percentage of money a corporation has left after subtracting all direct costs of producing or purchasing the goods or services it sells
- Market Cap (B): the total dollar market value of a company’s outstanding shares of stock in billions
- MER – Management Expense Ratio
- N/A – Not Applicable or Not Available
- P/B: Price-to-Book – this ratio measures the market’s valuation of a company relative to its book value
- P/E: Price-to-Earnings – this ratio relates a corporation’s share price to its earnings per share
- P/S: Price-to-Sales – this ratio divides the stock price by the underlying corporation’s sales per share
- Payout: Payout Ratio – the percentage of net income a firm pays in dividends
- Price: Stock Price – current value to buyers and sellers
- REV Y/Y (%): Yearly Revenue Growth – the percentage growth of the corporation’s revenue over the trailing twelve months
- Risk – Risk Rating (Volatility)
- Sector: group broadly similar companies
- Yield – Dividend or Distribution Yield
- YTD – Year to Date
- 1M – 1-Month Performance
- 3M – 3-Month Performance
- 1Y – 1-Year Performance
- 3Y – 3-Year Performance
- 5Y – 5-Year Performance
- 10Y – 10-Year Performance
- 15Y – 15-Year Performance
- 52-Week Range – the lowest and highest price at which a stock has traded during the previous 52-weeks
RBC Balanced Top 5 Holdings
- Cash & Cash Equivalents
- ENB.TO: Enbridge Inc.
- RBC Emerging Markets Equity Fund
- RY.TO: Royal Bank of Canada
- TD.TO: Toronto-Dominion Bank
RBC Balanced Top Sectors
- Financials: 25.1%
- Energy: 13.0%
- Industrials: 12.1%
- Technology: 11.0%
- Materials: 9.8%
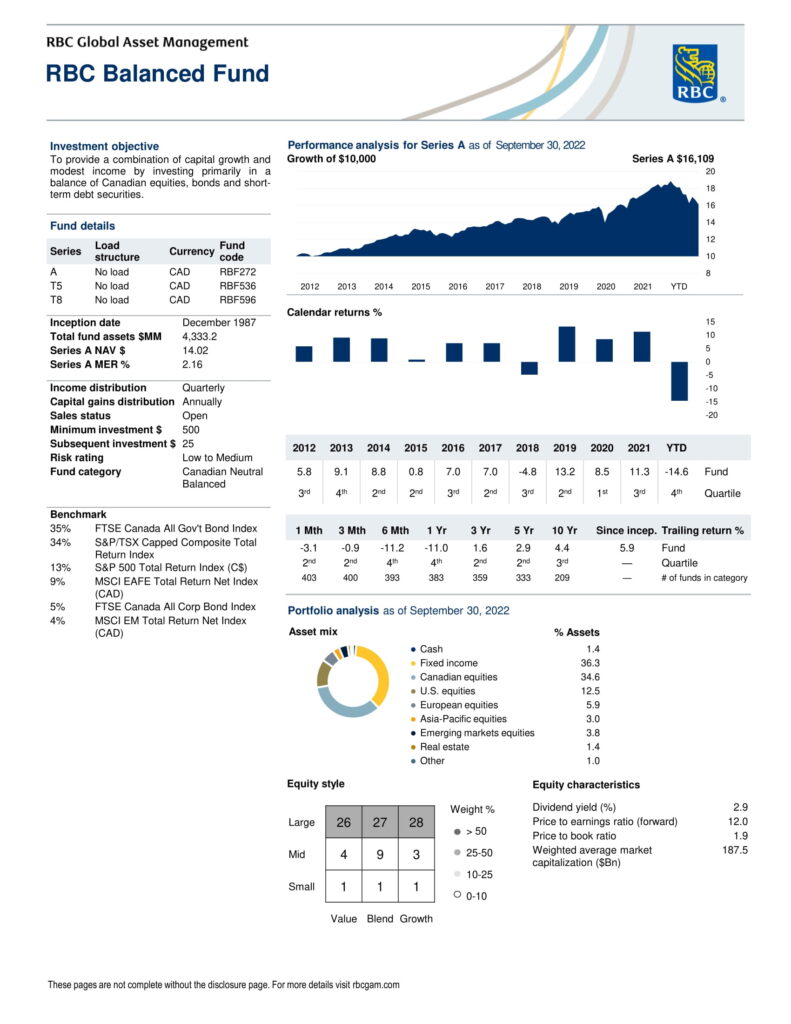
What Are The Best Canadian ETFs By Benchmark?
This table shows the asset allocation of the mutual fund with its respective high-calibre ETF.
| Benchmark | RBC Balanced Fund | ETF | MER | 5YR | Benchmark ETF Portfolio % MER | Benchmark ETF Portfolio % Returns |
|---|---|---|---|---|---|---|
| FTSE Canada All Gov’t Bond Index | 35% | XGB | 0.13% | 0.52% | 0.0455% | 0.182% |
| FTSE Canada All Corp Bond Index | 5% | VCB | 0.17% | 1.60% | 0.0085% | 0.08% |
| S&P/TSX Capped Composite Total Return Index | 34% | VDY | 0.22% | 9.72% | 0.0748% | 3.3048% |
| S&P 500 Total Return Index | 13% | SCHD | 0.06% | 11.69% | 0.0078% | 1.5197% |
| MSCI EAFE Total Return Net Index | 9% | ZEQ | 0.45% | 9.28% | 0.003645% | 0.8352% |
| MSCI EM Total Return Net Index | 4% | VEE | 0.24% | 0.60% | 0.0096% | 0.024% |
| Total | 100% | N/A | N/A | N/A | 0.1498% | 5.9457% |
My ETF Portfolio Recommendation
Here is a table building a balances (60/40) asset allocation ETF Portfolio as of January 31, 2023.
| Asset Class | Balanced (60/40) | ETF | MER | 5YR | My ETF Portfolio % MER | My ETF Portfolio % Returns |
|---|---|---|---|---|---|---|
| Fixed Income | 40% | PSA | 0.17% | 1.59% | 0.068% | 0.636% |
| Canadian | 15% | VDY | 0.22% | 9.72% | 0.033% | 1.458% |
| American | 30% | XUS | 0.06% | 11.69% | 0.018% | 3.507% |
| International | 10% | ZEQ | 0.45% | 9.28% | 0.045% | 0.928% |
| Emerging Markets | 5% | XID | 0.99% | 5.56% | 0.0495% | 0.278% |
| Total | 100% | N/A | N/A | N/A | 0.2135% | 6.807% |
- Allocation: Asset Allocation – involves dividing your investments among different assets, such as stocks, bonds, and cash
- Asset Class – is a grouping of investments that exhibit similar characteristics
- ETF – Exchange Traded Fund
- MER – Management Expense Ratio
- 5YR – 5-Year Performance
Related
 |  |  |  |  |  |
|---|---|---|---|---|---|
| Advice | InvestCAN | InvestRESP | InvestUSA | RetireCAN | RetireMGN |
| $500.00 CAD $400.00 USD | $99.99 CAD | $79.99 USD | $99.99 CAD | $12.99 CAD $9.99 USD |
 Rishi Vikram2024-06-03Nic is client focused advisor . Honest advice is rare in today’s world But Nic gave good ,Simple and to the point information.
 Sunny2024-02-29Nic's vast knowledge in financial investments is exceptional. Highly recommended.
 Peter Vigna2024-01-27Nic is the best source for financial education on social media best etf recommendations.
 519 Painting2023-05-01Nick was a tremendous help with our financial planning for our new company!
 Shiella A2022-06-30Nic is professional, intuitive, personable and passionate about his role. We are so gald to have Nic as our financial advisor; our portfolios are well managed and we have been happy with the outcomes over the years. Nic always goes out of his way to help us. We had a bad experience with our Canada life mortgage broker, his lack of support and responsiveness almost cost our family a great opportunity so we had to move on. We honestly wish Nic was able to handle our mortgage needs as well. This will ensure that all our service needs will be well managed. Thank you Nic for everything you do!
 Jake Thuss2022-06-25Nic is the best financial advisor I have come across in London, Ontario. He knowledgeably helped us with our investments, life insurance and a mortgage. He is a great financial planner to deal with!
 John Vella2021-06-10This was my first experience with a financial planner. Nic took the time to explain everything to me. He is very patient and thorough. We talked about my goals and plans for retirement. We also talked about my comfort level when it comes to the the ups and downs of investing. I felt very comfortable with Nic. He is down to earth and very knowledgeable. I would highly recommend Nic to anyone needing a financial planner. I feel much more comfortable with my investment plan because of Nic and look forward to working with him for all my investment needs.
 Jimal Isovski2021-05-11My experience dealing with Nic was flawless. He was extremely informative, supportive and organized when dealing with all my questions and investments. He truly looks out for his clients and does whatever it takes to go above and beyond for their success.
 Karen Campbell2021-05-10Nic always has your best interest in mind. Very knowledgeable, respectful of your time and very keen. Trust-worthy too.