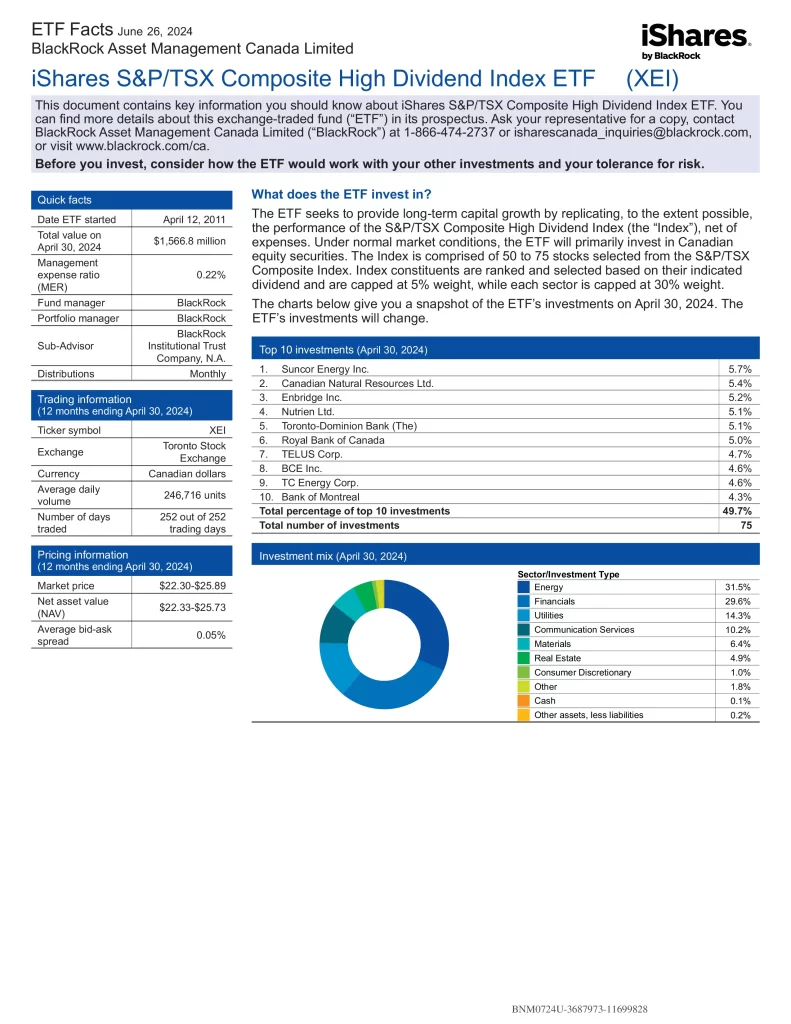
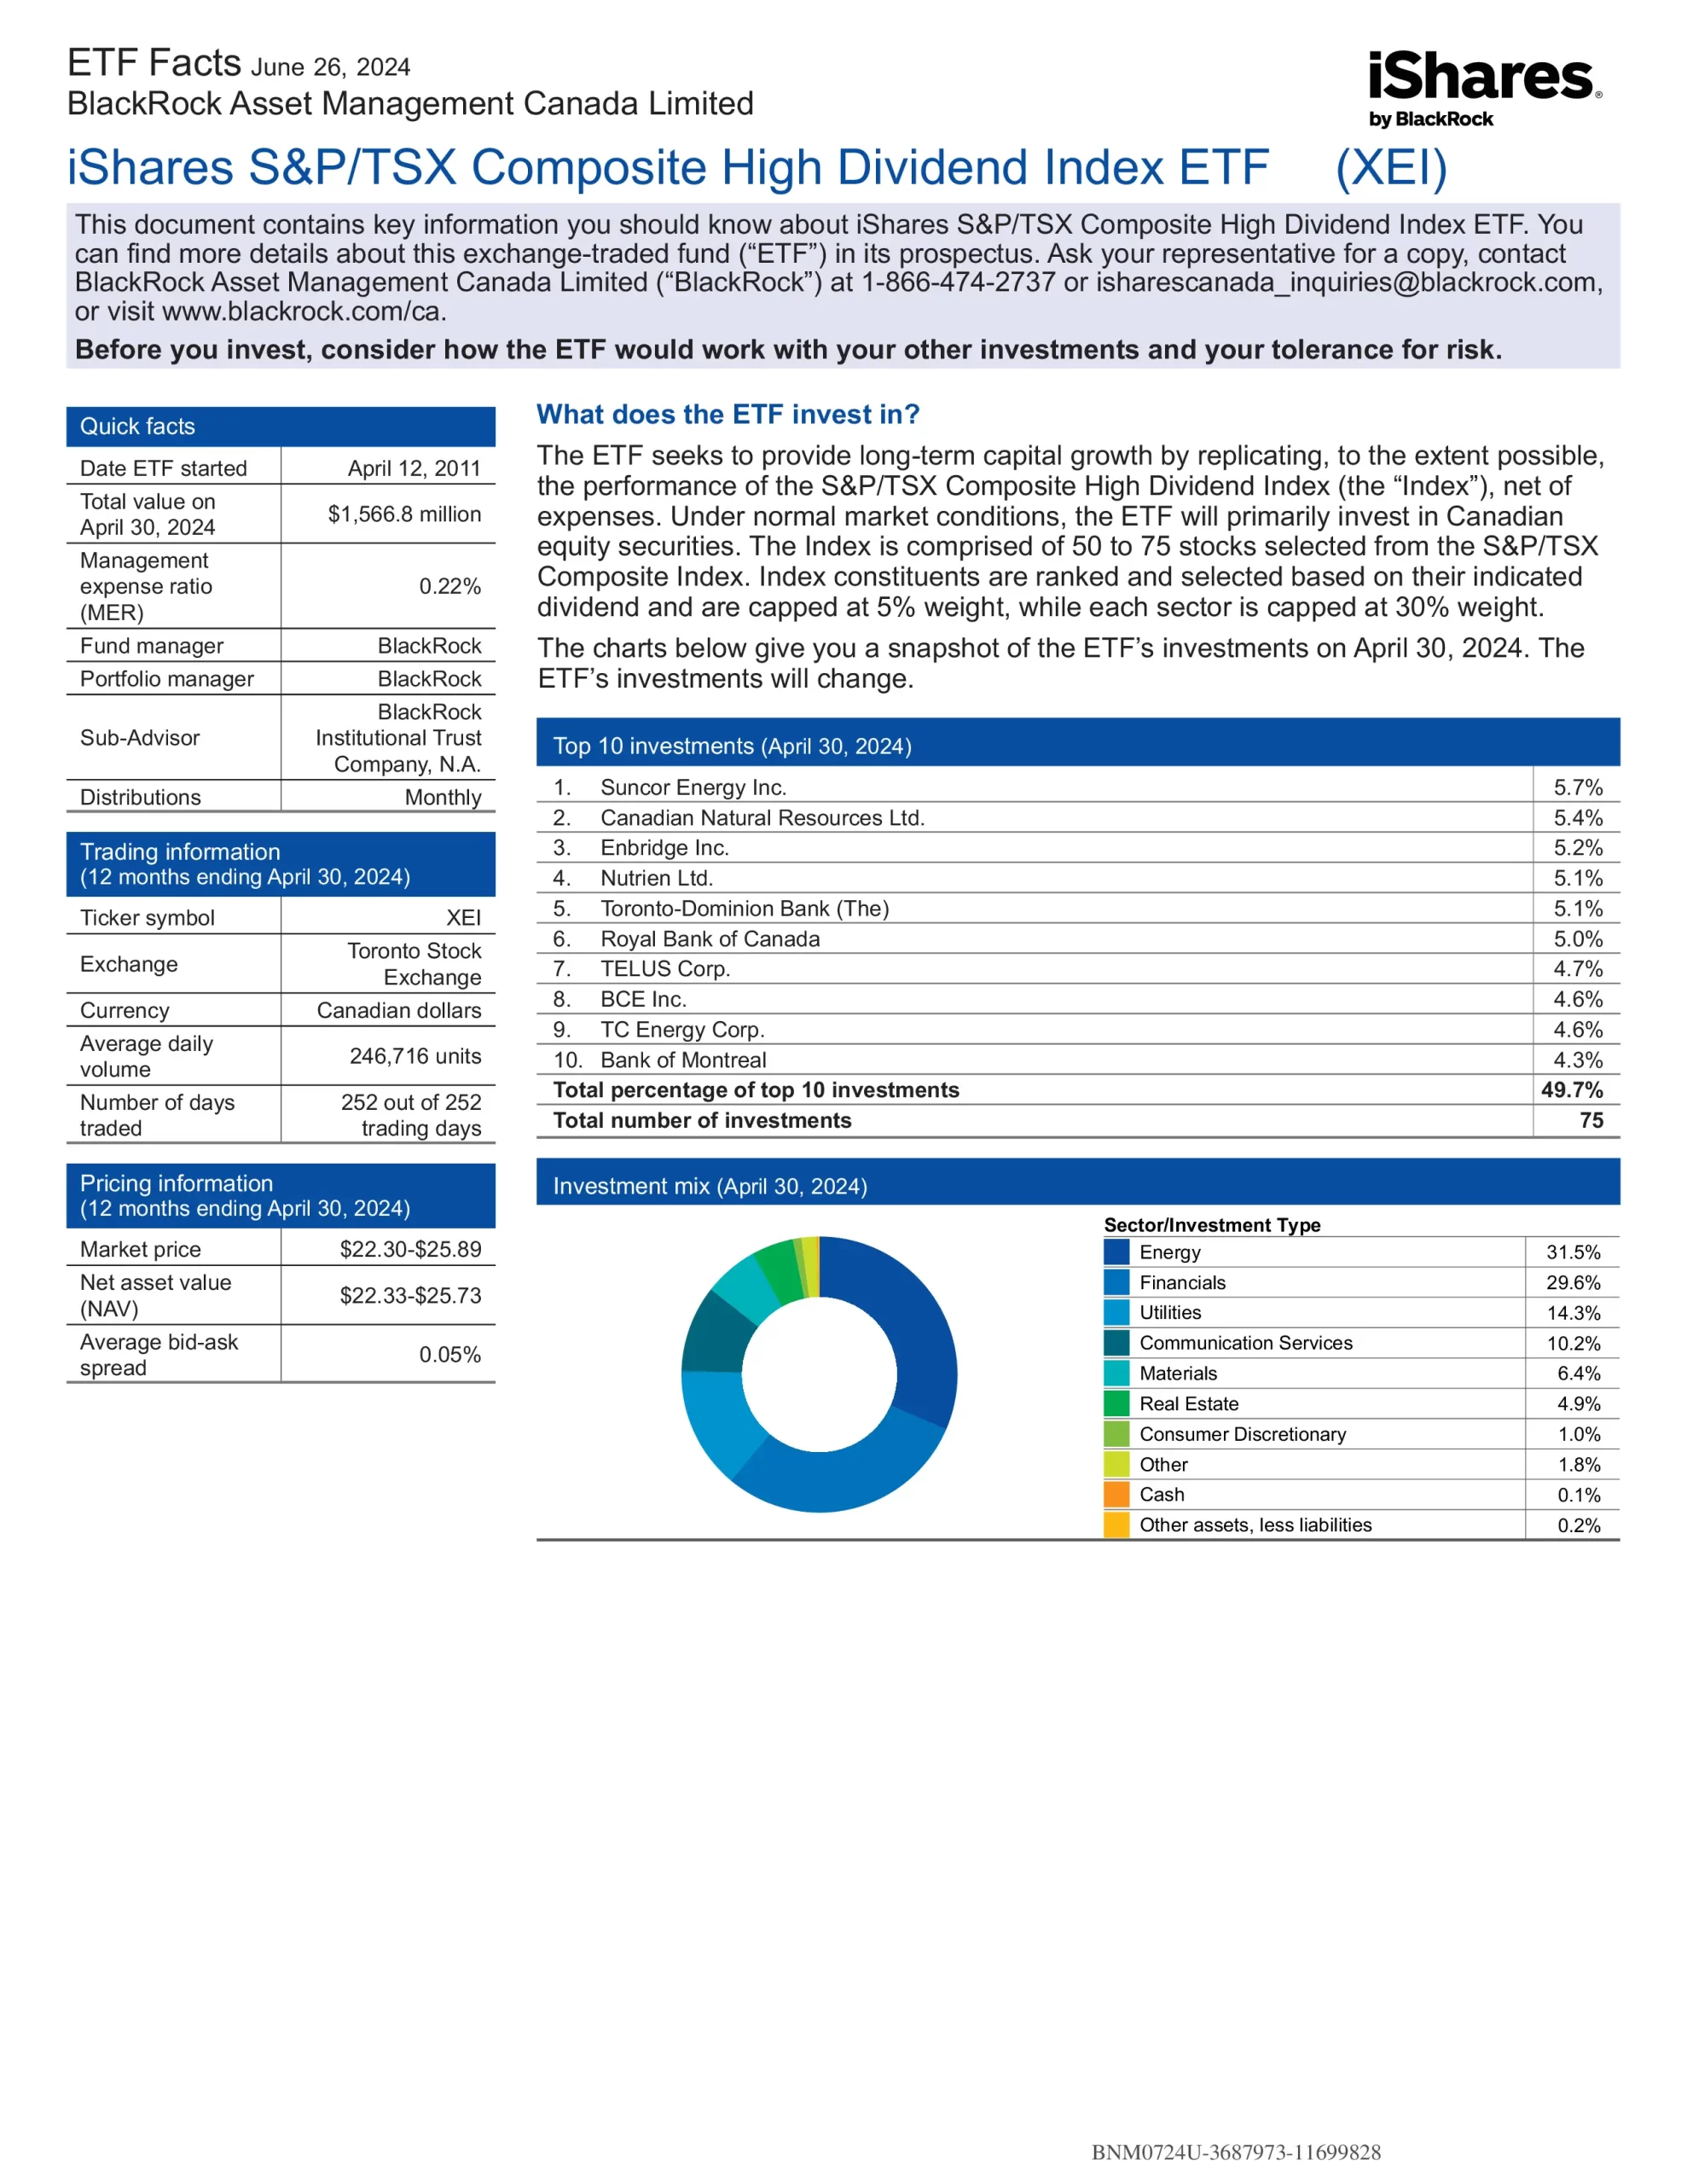
More information about iShares S&P/TSX Composite High Dividend Index ETF (XEI) is in its prospectus. Before investing in an Exchange Traded Fund (ETF), it’s important to assess how it fits within your portfolio and aligns with your risk tolerance. ETF prices can also experience higher volatility during market openings and closings and there is always the possibility of losing money. It’s also worth noting that a narrower bid-ask spread generally indicates higher liquidity, meaning you’re more likely to execute trades at expected prices. Always consider these factors carefully when making investment decisions, as even ETFs considered low-risk can experience losses under certain market conditions.
XEI ETF Review
iShares S&P/TSX Composite High Dividend Index ETF (XEI) seeks long-term capital growth by replicating the performance of the S&P/TSX Composite High Dividend Index. The ETF seeks to provide long-term capital growth by primarily investing in Canadian equity securities. The Index is comprised of 50 to 75 stocks selected from the S&P/TSX Composite Index. Index constituents are ranked and selected based on their indicated dividend and are capped at 5% weight, while each sector is capped at 30% weight.
Companies that pay dividends are signs of maturity and strength. Dividends can ease the effects of market volatility if they are reinvested. They have better valuation metrics and a higher dividend yield than the broader Canadian market. These companies tend to have proven management, solid balance sheets and strong cash flow.


Top 10 XEI Holdings
| Ticker | Name | Weight |
|---|---|---|
| SU | SUNCOR ENERGY INC | 5.21% |
| CNQ | CANADIAN NATURAL RESOURCES LTD | 5.06% |
| NTR | NUTRIEN LTD | 5.03% |
| RY | ROYAL BANK OF CANADA | 5.02% |
| TRP | TC ENERGY CORP | 5.02% |
| ENB | ENBRIDGE INC | 5.00% |
| TD | TORONTO DOMINION | 4.97% |
| BCE | BCE INC | 4.71% |
| T | TELUS CORP | 4.71% |
| BMO | BANK OF MONTREAL | 4.42% |
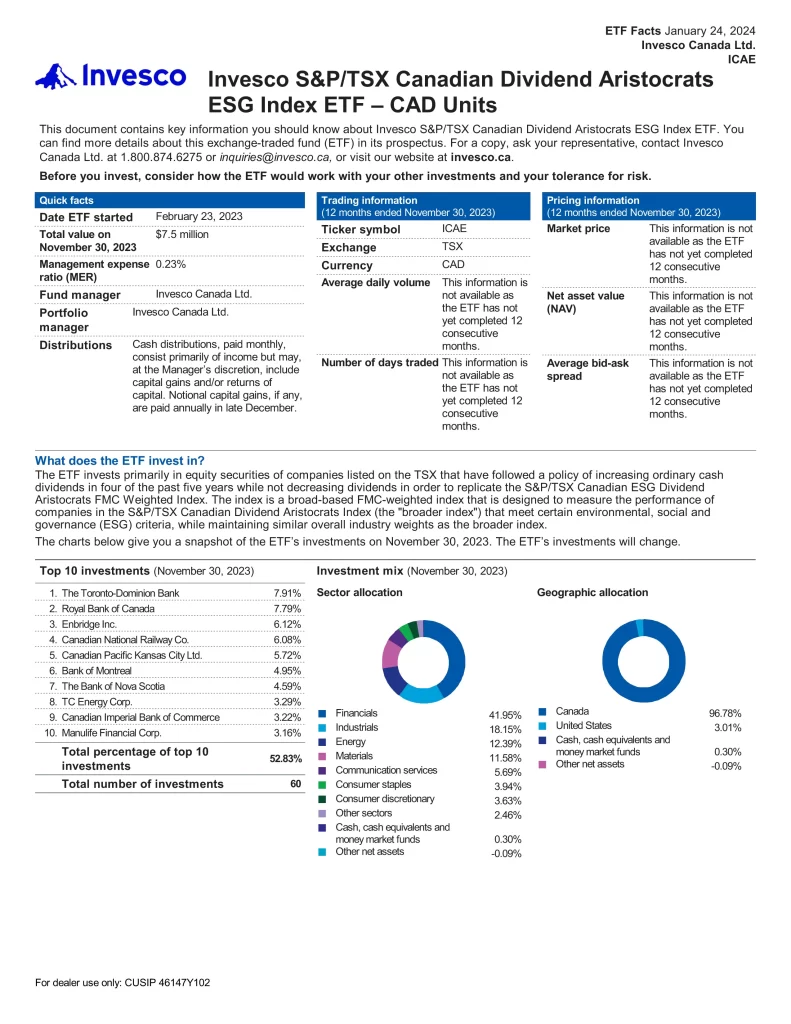
Is XEI a Good ETF?
| Manager | ETF | Name | Risk | Inception | AUM | MER | Holdings | Beta | P/E | P/B | P/S | P/CF | Yield | Distributions | 1Y | 3Y | 5Y | 10Y | 15Y |
|---|---|---|---|---|---|---|---|---|---|---|---|---|---|---|---|---|---|---|---|
| BlackRock | CDZ | iShares S&P/TSX Canadian Dividend Aristocrats Index ETF | Medium | 2006-09-08 | $965,375,187 | 0.66% | 92 | 0.87 | 12.78 | 1.53 | 1.06 | 5.36 | 4.39% | Monthly | 20.07% | 7.90% | 8.80% | 7.06% | 8.48% |
| BlackRock | XDIV | iShares Core MSCI Canadian Quality Dividend Index ETF | Medium | 2017-06-07 | $1,915,492,719 | 0.11% | 20 | 0.78 | 12.32 | 1.63 | 1.15 | 6.37 | 4.80% | Monthly | 23.01% | 11.45% | 11.29% | N/A | N/A |
| BlackRock | XDV | iShares Canadian Select Dividend Index ETF | Medium | 2005-12-19 | $1,765,321,674 | 0.55% | 31 | 0.90 | 11.74 | 1.48 | 1.38 | 5.55 | 5.20% | Monthly | 21.31% | 6.18% | 9.38% | 7.12% | 8.05% |
| BlackRock | XEI | iShares S&P/TSX Composite High Dividend Index ETF | Medium | 2011-04-12 | $1,730,180,828 | 0.22% | 75 | 0.91 | 12.98 | 1.51 | 1.39 | 5.63 | 5.61% | Monthly | 15.34% | 7.34% | 9.17% | 7.37% | N/A |
| BlackRock | XIC | iShares Core S&P/TSX Capped Composite Index ETF | Medium | 2001-02-16 | $14,892,749,002 | 0.06% | 224 | 1.00 | 15.05 | 1.93 | 1.70 | 8.31 | 3.04% | Quarterly | 21.52% | 8.51% | 11.04% | 8.62% | 8.17% |
| BlackRock | XIU | iShares S&P/TSX 60 Index ETF | Medium | 1999-09-28 | $16,445,894,701 | 0.18% | 61 | 1.00 | 15.71 | 2.04 | 1.92 | 9.09 | 3.18% | Quarterly | 20.77% | 8.14% | 11.27% | 8.88% | 8.28% |
| BMO | ZDV | BMO Canadian Dividend ETF | Medium | 2011-11-21 | $1,134,600,000 | 0.39% | 53 | 0.93 | 14.35 | 1.88 | 1.50 | 7.05 | 4.35% | Monthly | 16.88% | 7.55% | 9.10% | 7.00% | N/A |
| BMO | ZWC | BMO Canadian High Dividend Covered Call ETF | Medium | 2017-02-03 | $1,605,920,000 | 0.72% | 101 | 0.88 | 13.86 | 1.85 | 1.52 | 7.19 | 6.73% | Monthly | 11.97% | 5.12% | 6.29% | N/A | N/A |
| Vanguard | VDY | Vanguard FTSE Canadian High Dividend Yield Index ETF | Medium | 2011-10-21 | $3,320,000,000 | 0.22% | 56 | 0.94 | 12.70 | 1.63 | 1.87 | 6.09 | 5.08% | Monthly | 21.38% | 9.47% | 12.14% | 9.04% | N/A |
XEI vs VDY
VDY is the better ETF. VDY is the superior performing, less volatile, better value, more popular ETF than XEI which is older, more diversified and costs the same.
XEI vs XIC
XIC is the better ETF. XIC is the superior performing, older, less volatile, better value, more popular, less expensive ETF than XEI which is more diversified.
XEI vs XIU
XIU is the better ETF. XIU is the superior performing, older, more diversified, better value, more popular, less expensive ETF than XEI which is less volatile.
XEI vs XDIV
XDIV is the better ETF. XDIV is the superior performing, less expensive, less volatile, better value, more popular ETF than XEI which is older and more diversified.
XEI vs ZWC
XEI is the better ETF. XEI is the superior performing, older, less expensive, less volatile, better value, more popular ETF than ZWC which is more diversified.
XEI vs CDZ
CDZ is the better ETF. CDZ is the superior performing, older, less expensive, more diversified, less volatile, better value, and more popular ETF than XEI.
XEI vs XDV
XEI is the better ETF. XEI is the superior performing, older, less expensive, less volatile, better value, more popular ETF than XDV which is more diversified.
XEI vs ZDV
XEI is the better ETF. XEI is the superior performing, less expensive, less volatile, better value, more popular ETF than ZDV which is older and more diversified.


