What is the Best Dividend ETF in Canada?
The best-performing Canadian dividend ETF is Vanguard FTSE Canadian High Dividend Yield Index ETF (VDY) which offers superior diversification and reliable income, but it’s crucial to note that not all dividend ETFs are equal. Dividend ETFs are designed for income investors who want a high level of sustainable dividend income, as well as the potential for portfolio gains. Individuals seeking income in Canada frequently turn to a dividend exchange-traded fund (ETF). These investments purchase dividend stocks and offer investors a low-cost way to create passive income. Canadian dividend ETFs focus on stocks offering higher yields, typically comprising established companies that distribute modest income to investors rather than reinvesting profits. These ETFs deliver a dependable income stream and are viewed as stable long-term investments, occasionally providing monthly dividends. These companies are often well-established blue-chip entities with a history of consistent dividend payouts. The final result is well-diversified core portfolio solutions for income investors.
Canadian Dividend ETF List
If you’re looking for the best Canadian dividend ETFs, here is a list based on their five-year annualized returns:
- VDY: Vanguard FTSE Canadian High Dividend Yield Index ETF
- DXC: Dynamic Active Canadian Dividend ETF
- XDIV: iShares Core MSCI Canadian Quality Dividend Index ETF
- RCD: RBC Quant Canadian Dividend Leaders ETF
- HXH: Global X Canadian High Dividend Index Corporate Class ETF
- TQCD: TD Q Canadian Dividend ETF
- XEI: iShares S&P/TSX Composite High Dividend Index ETF
- ZDV: BMO Canadian Dividend ETF
- DGRC: CI WisdomTree Canada Quality Dividend Growth Index ETF
- CDZ: iShares S&P/TSX Canadian Dividend Aristocrats Index ETF
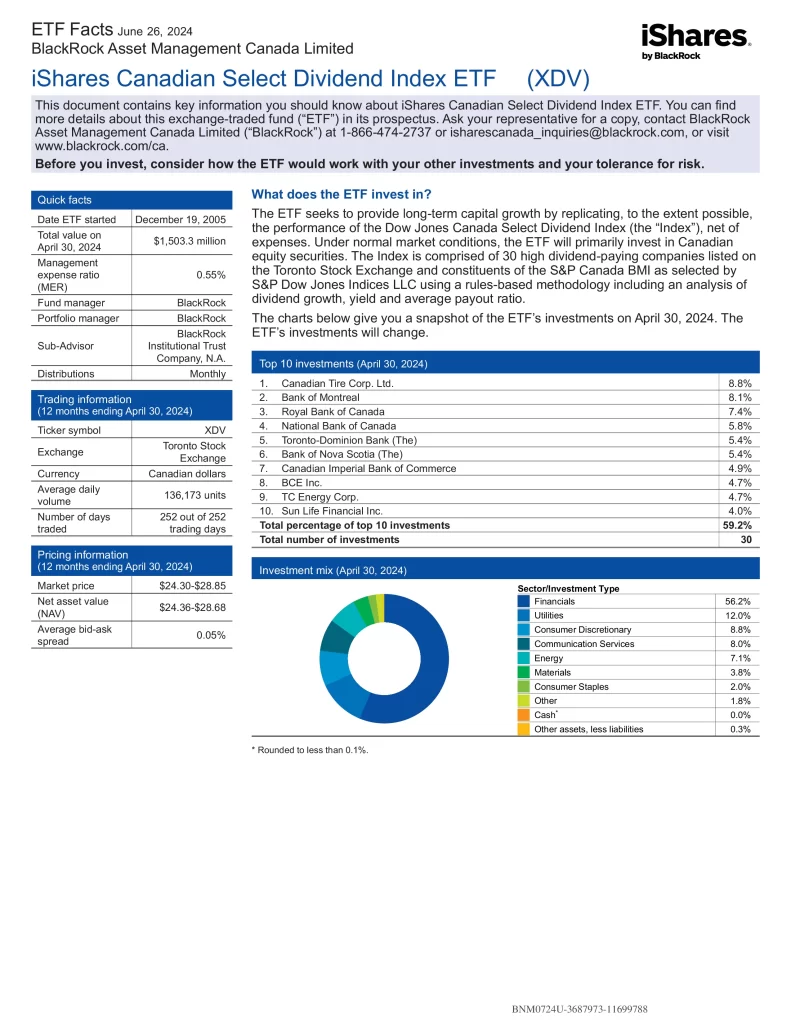
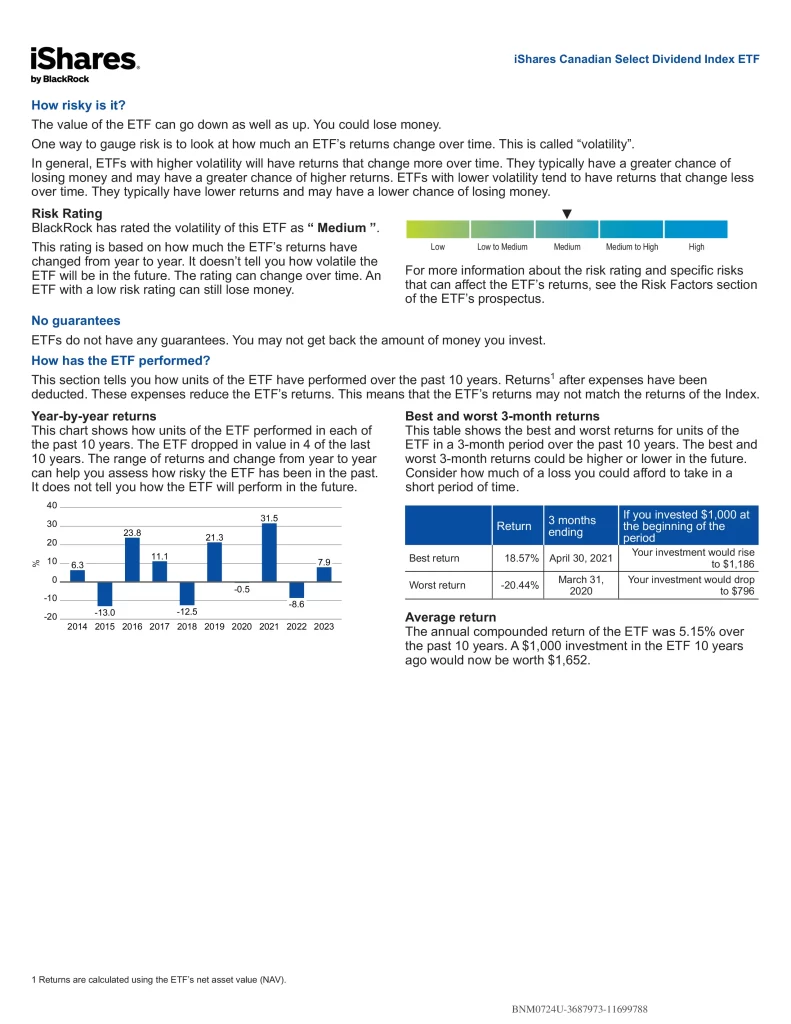
- XDV: iShares Canadian Select Dividend Index ETF
- PDC: Invesco Canadian Dividend Index ETF
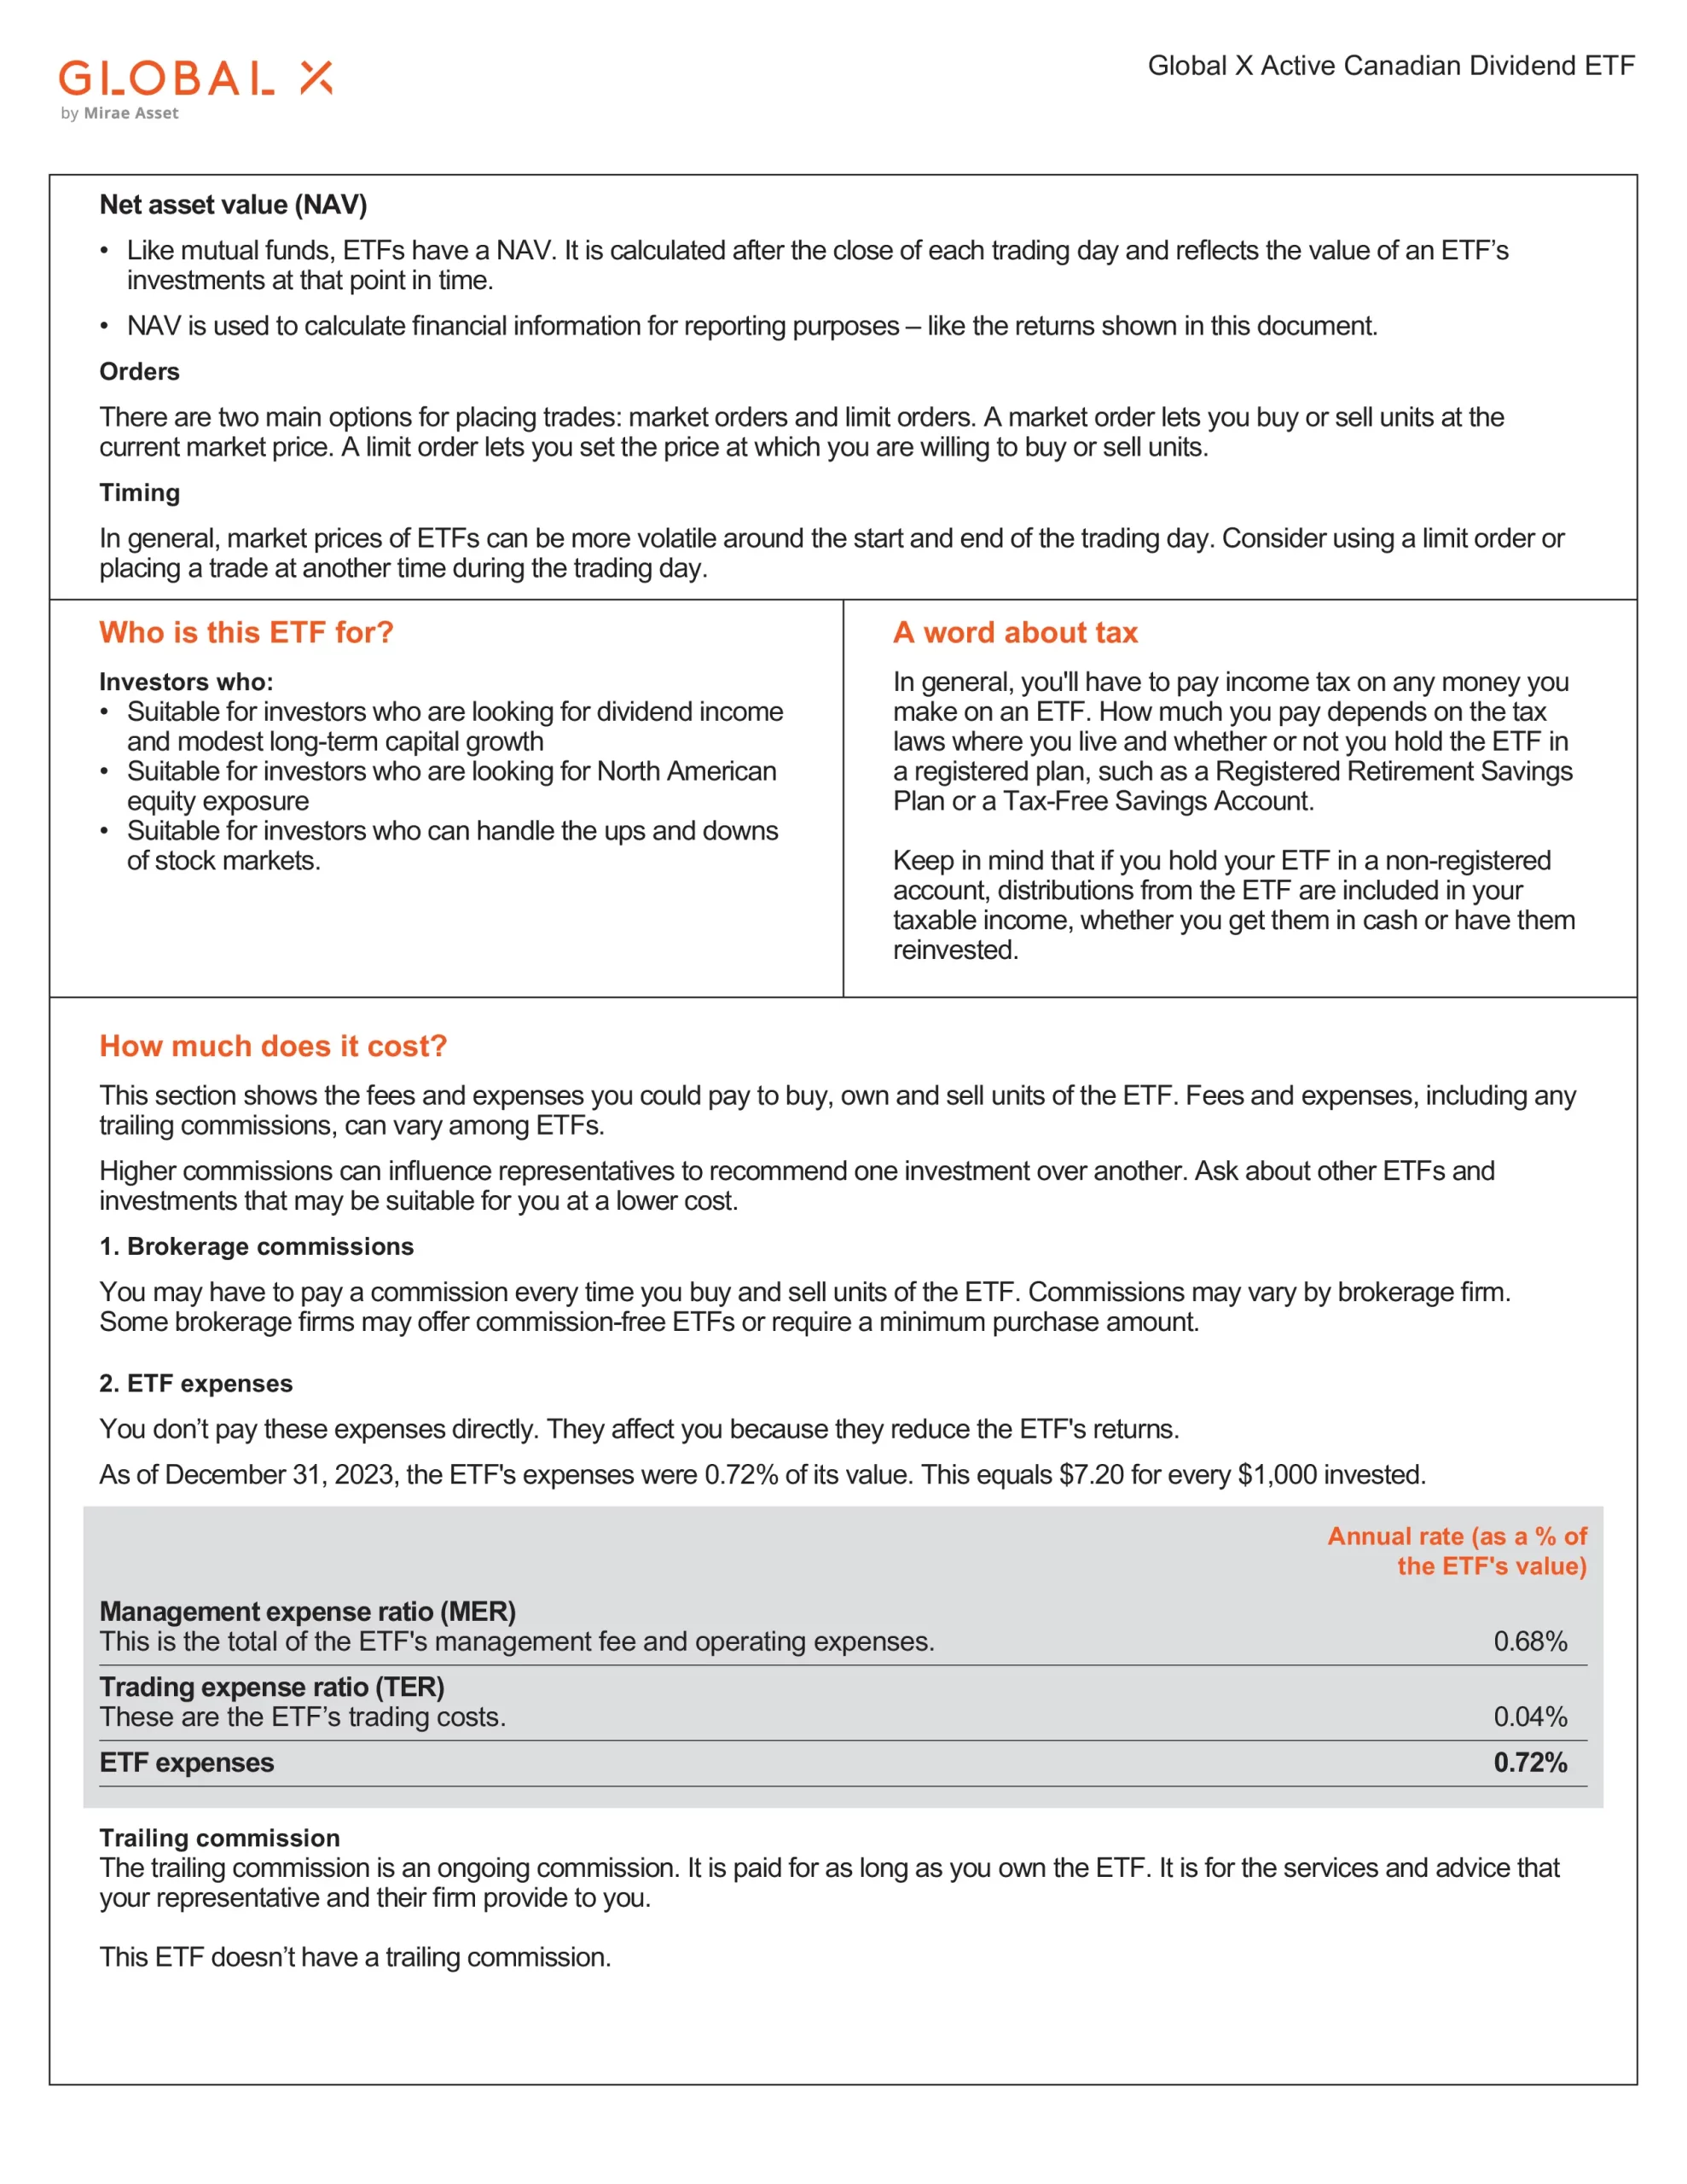
- HAL: Global X Active Canadian Dividend ETF
- FCCD: Fidelity Canadian High Dividend ETF
- ZWC: BMO Canadian High Dividend Covered Call ETF
- NDIV: NBI Canadian Dividend Income ETF
- CQLC: CIBC Qx Canadian Low Volatility Dividend ETF
- FLVC: Franklin Canadian Low Volatility High Dividend Index ETF
- RCDC: RBC Canadian Dividend Covered Call ETF
- ICAE: Invesco S&P/TSX Canadian Dividend Aristocrats ESG Index ETF
- CWIN: Hamilton Champions Enhanced Canadian Dividend ETF
- CMVP: Hamilton Champions Canadian Dividend Index ETF
Canadian Dividend ETF Comparison
Here’s a closer look at each Canadian dividend ETF of 2025. Quickly compare Canadian Dividend ETFs by fees, performance, yield, and other metrics to decide which ETF fits in your portfolio.
| Manager | ETF | Name | Risk | Inception | AUM | MER | P/E | Yield | Beta | Distributions | Holdings | 5Y |
|---|---|---|---|---|---|---|---|---|---|---|---|---|
| BlackRock | CDZ | iShares S&P/TSX Canadian Dividend Aristocrats Index ETF | Medium | 2006-09-08 | $1,004,000,000 | 0.66% | 13.77 | 3.55% | 0.88 | Monthly | 92 | 9.82% |
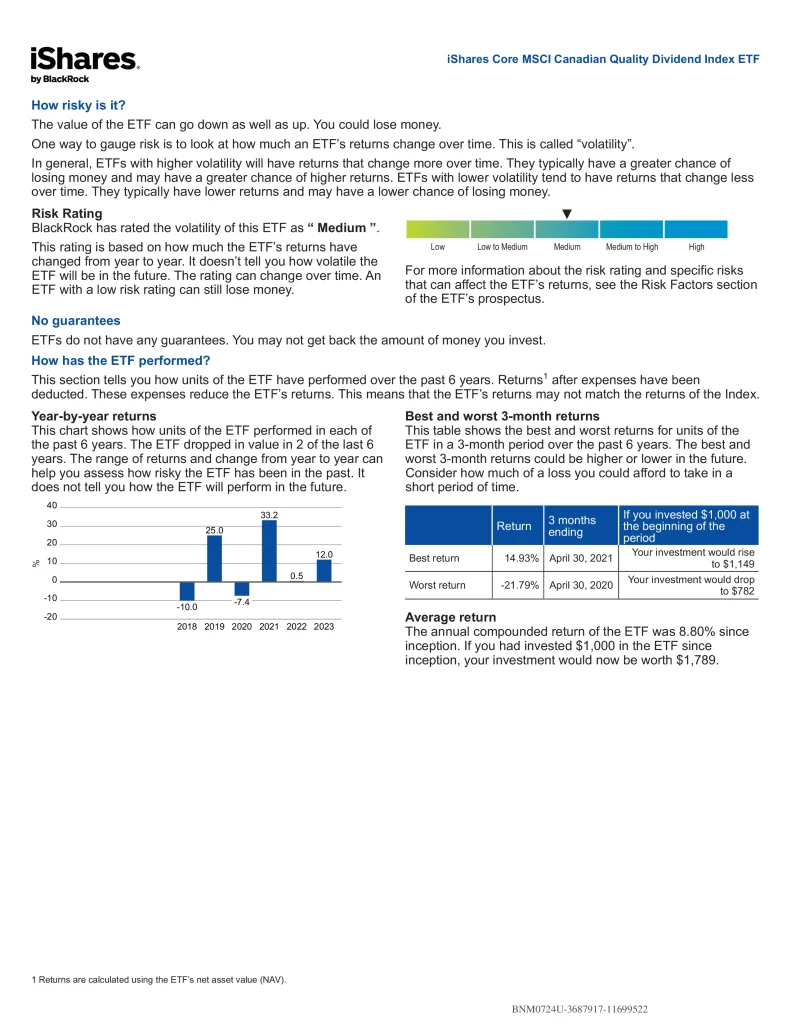
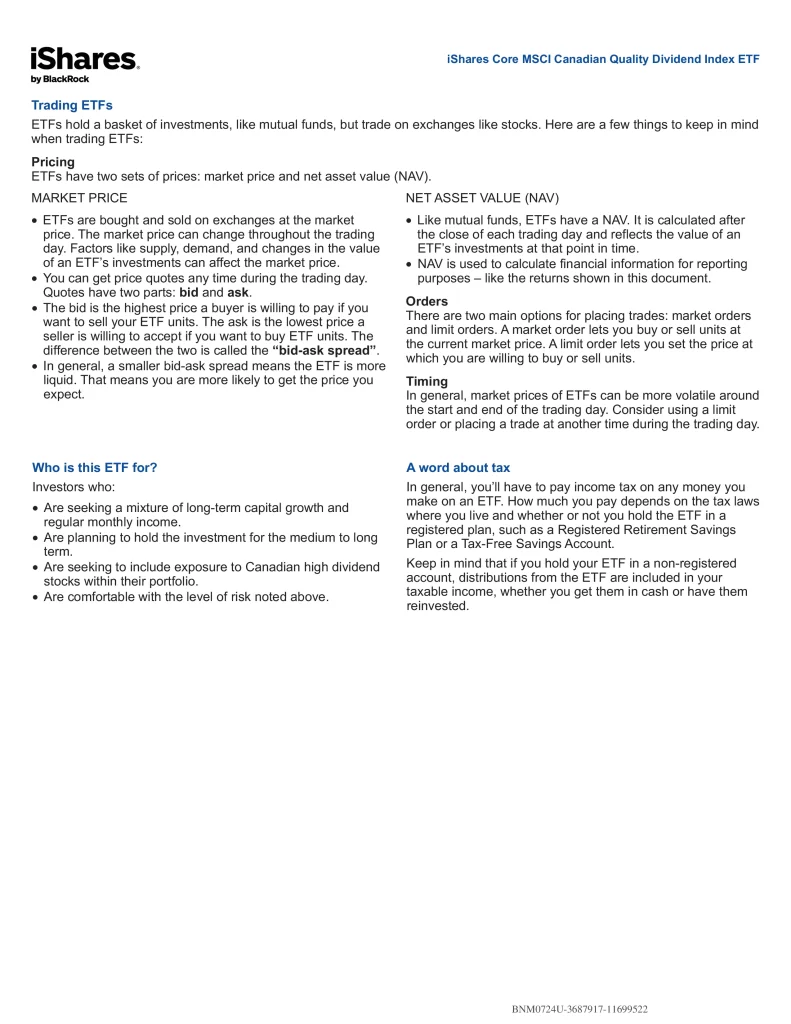
| BlackRock | XDIV | iShares Core MSCI Canadian Quality Dividend Index ETF | Medium | 2017-06-07 | $1,871,598,476 | 0.11% | 14.90 | 4.24% | 0.79 | Monthly | 17 | 11.92% |
| BlackRock | XDV | iShares Canadian Select Dividend Index ETF | Medium | 2005-12-19 | $1,788,221,831 | 0.55% | 11.82 | 4.25% | 0.92 | Monthly | 31 | 9.71% |
| BlackRock | XEI | iShares S&P/TSX Composite High Dividend Index ETF | Medium | 2011-04-12 | $1,730,180,828 | 0.22% | 11.72 | 4.87% | 0.91 | Monthly | 75 | 10.22% |
| BMO | ZDV | BMO Canadian Dividend ETF | Medium | 2011-11-21 | $1,134,600,000 | 0.39% | 19.36 | 3.76% | 0.93 | Monthly | 53 | 10.02% |
| BMO | ZWC | BMO Canadian High Dividend Covered Call ETF | Medium | 2017-02-03 | $1,622,220,000 | 0.72% | 18.35% | 6.48% | 0.88 | Monthly | 101 | 6.99% |
| CI | DGRC | CI WisdomTree Canada Quality Dividend Growth Index ETF | Medium | 2017-09-19 | $863,680,000 | 0.23% | 16.11 | 2.11% | 0.83 | Quarterly | 51 | 9.94% |
| CIBC | CQLC | CIBC Qx Canadian Low Volatility Dividend ETF | Medium | 2021-11-16 | $2,766,395 | 0.34% | N/A | 2.96% | 0.76 | Monthly | 40 | N/A |
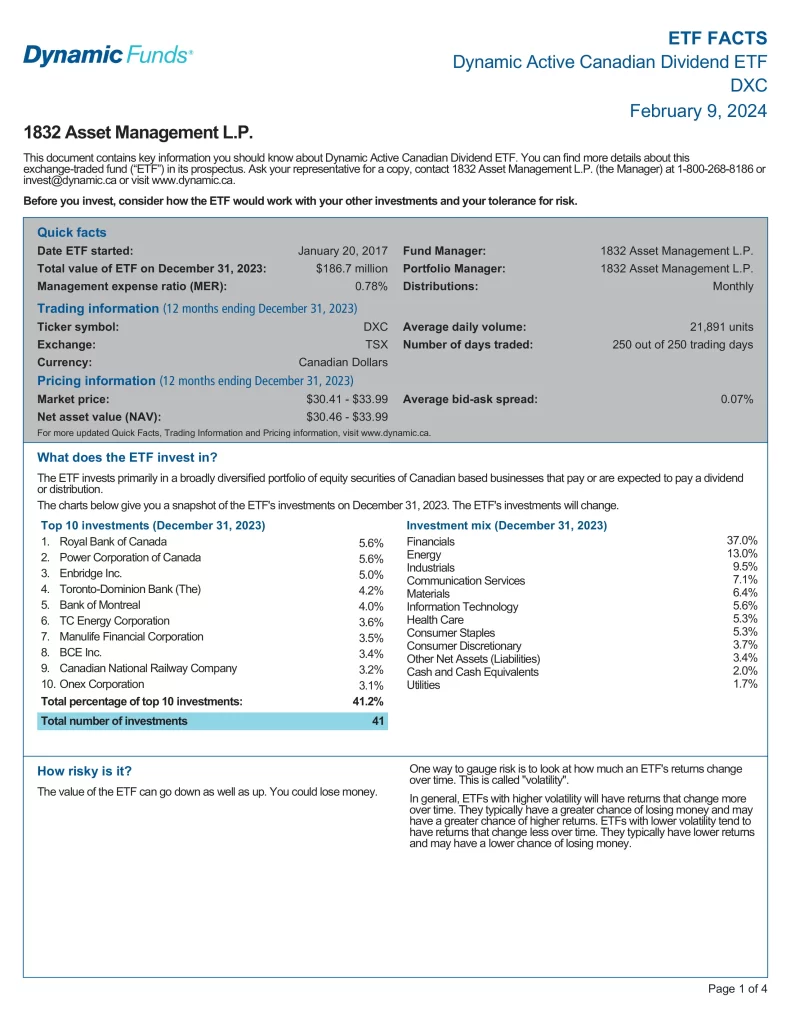
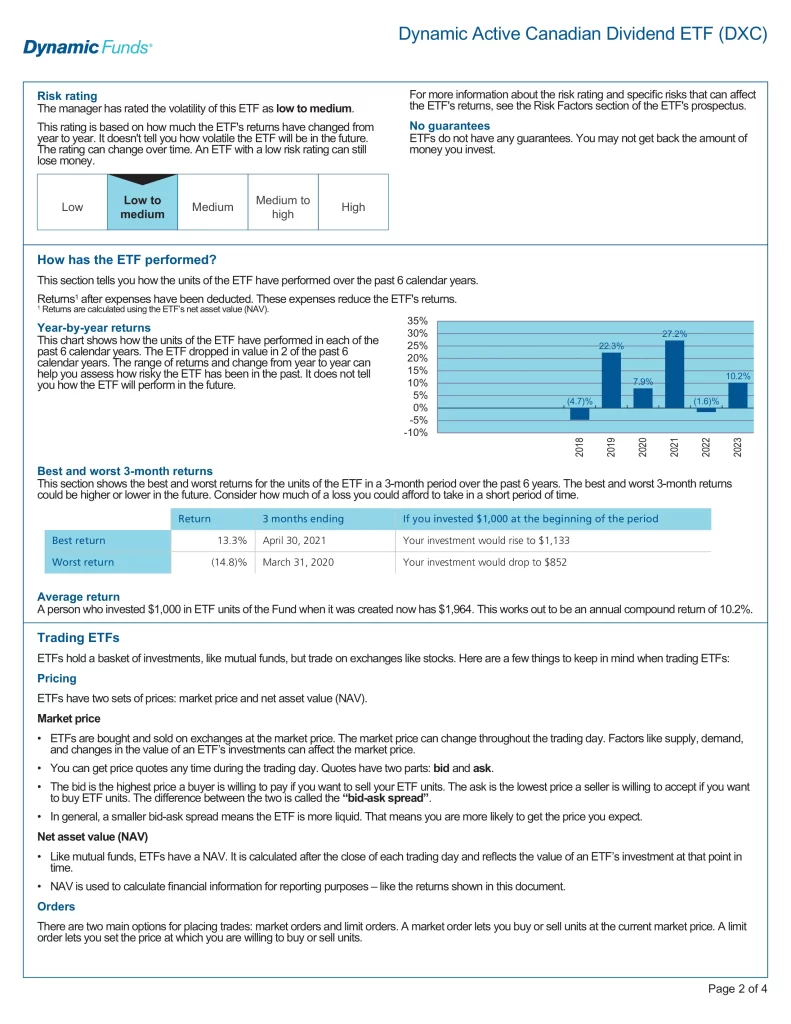
| Dynamic | DXC | Dynamic Active Canadian Dividend ETF | Low to Medium | 2017-01-20 | $323,850,000 | 0.72% | N/A | 2.49% | 0.83 | Monthly | 40 | 12.02% |
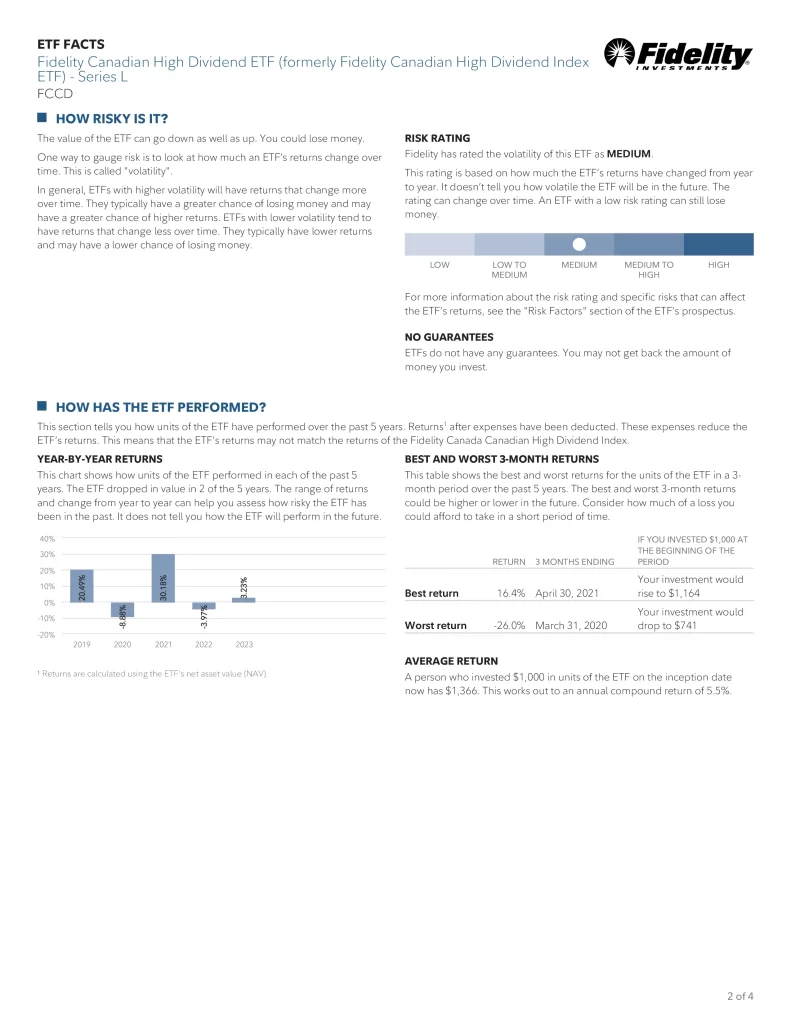
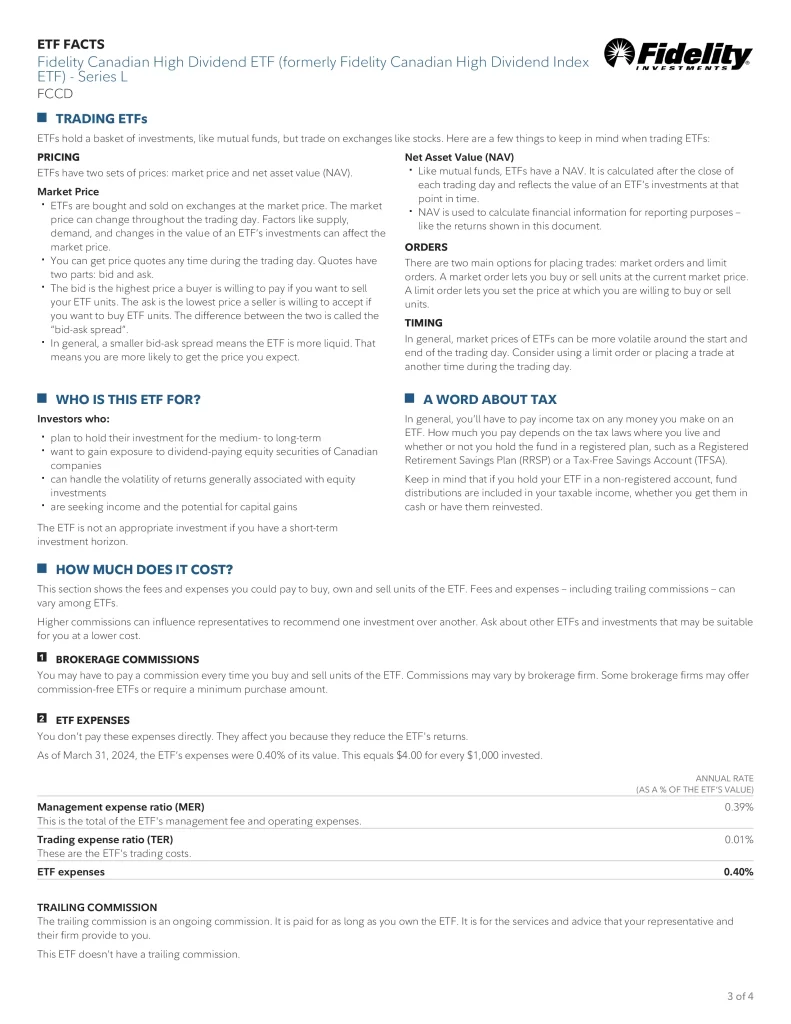
| Fidelity | FCCD | Fidelity Canadian High Dividend ETF | Medium | 2018-09-13 | $212,700,000 | 0.39% | 16.67 | 3.88% | 0.93 | Monthly | 67 | 7.57% |
| Franklin Templeton | FLVC | Franklin Canadian Low Volatility High Dividend Index ETF | Medium | 2024-03-28 | $54,160,000 | 0.28% | 15.45 | N/A | N/A | Monthly | 38 | N/A |
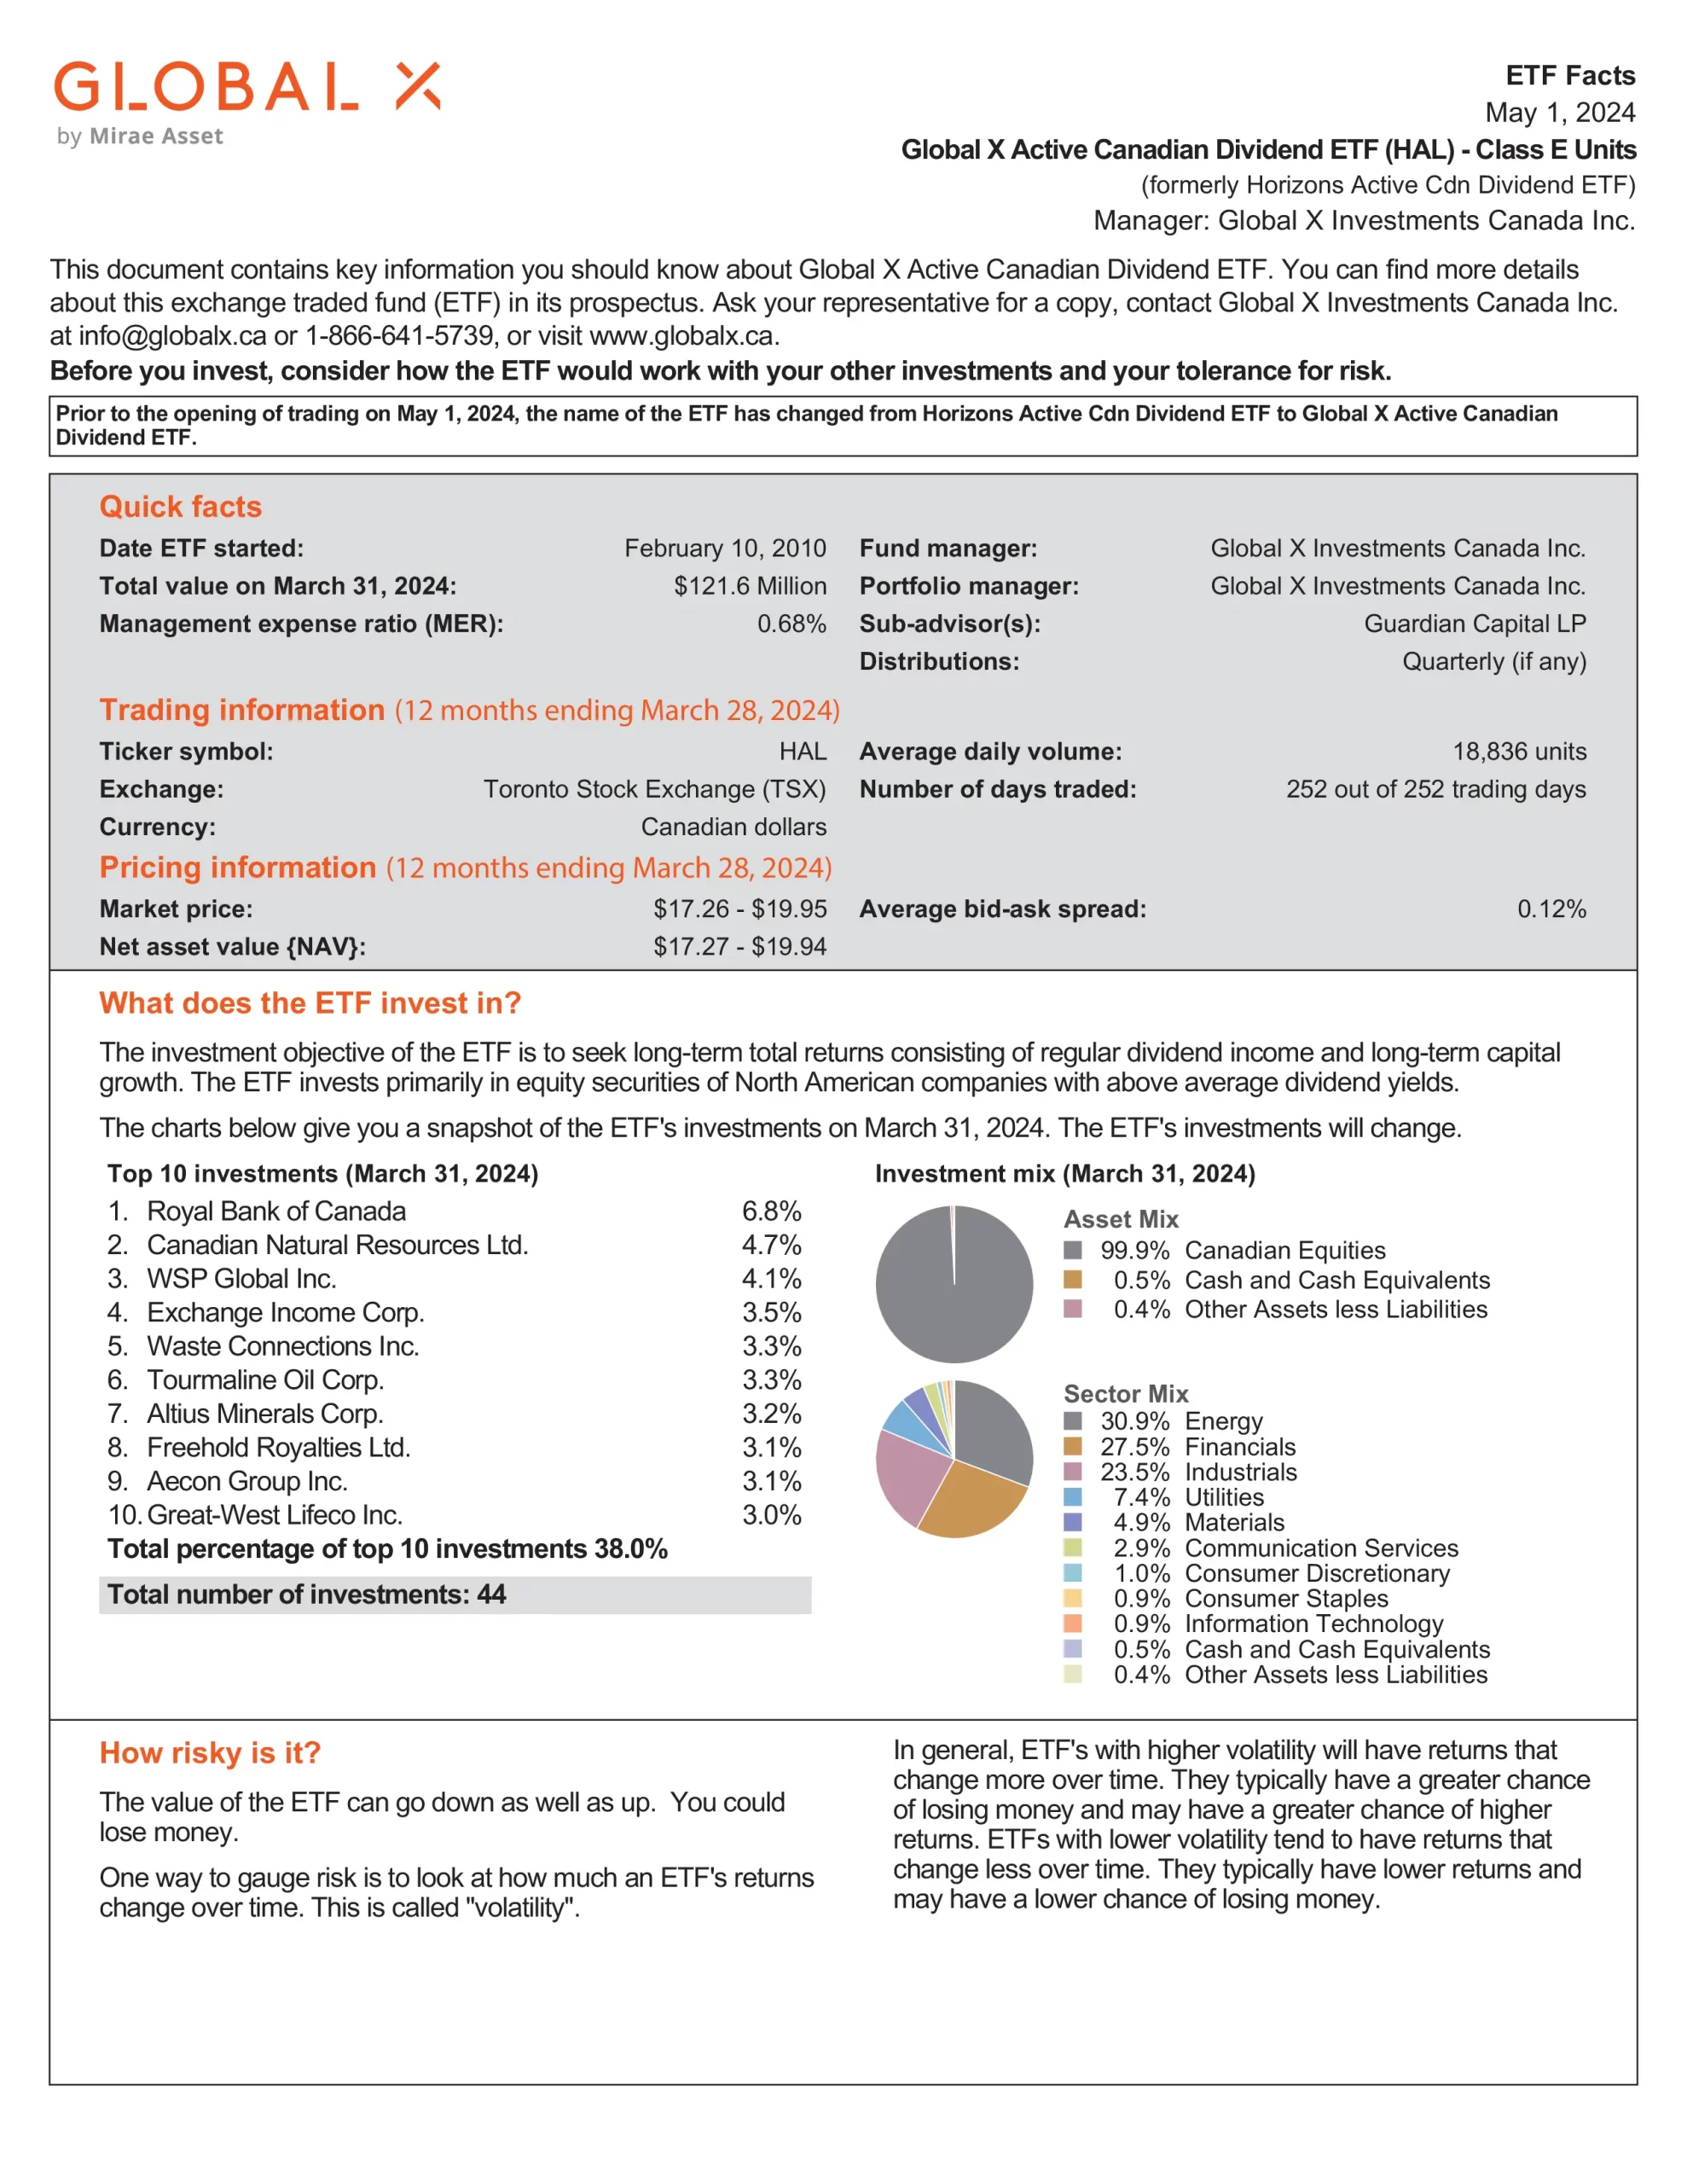
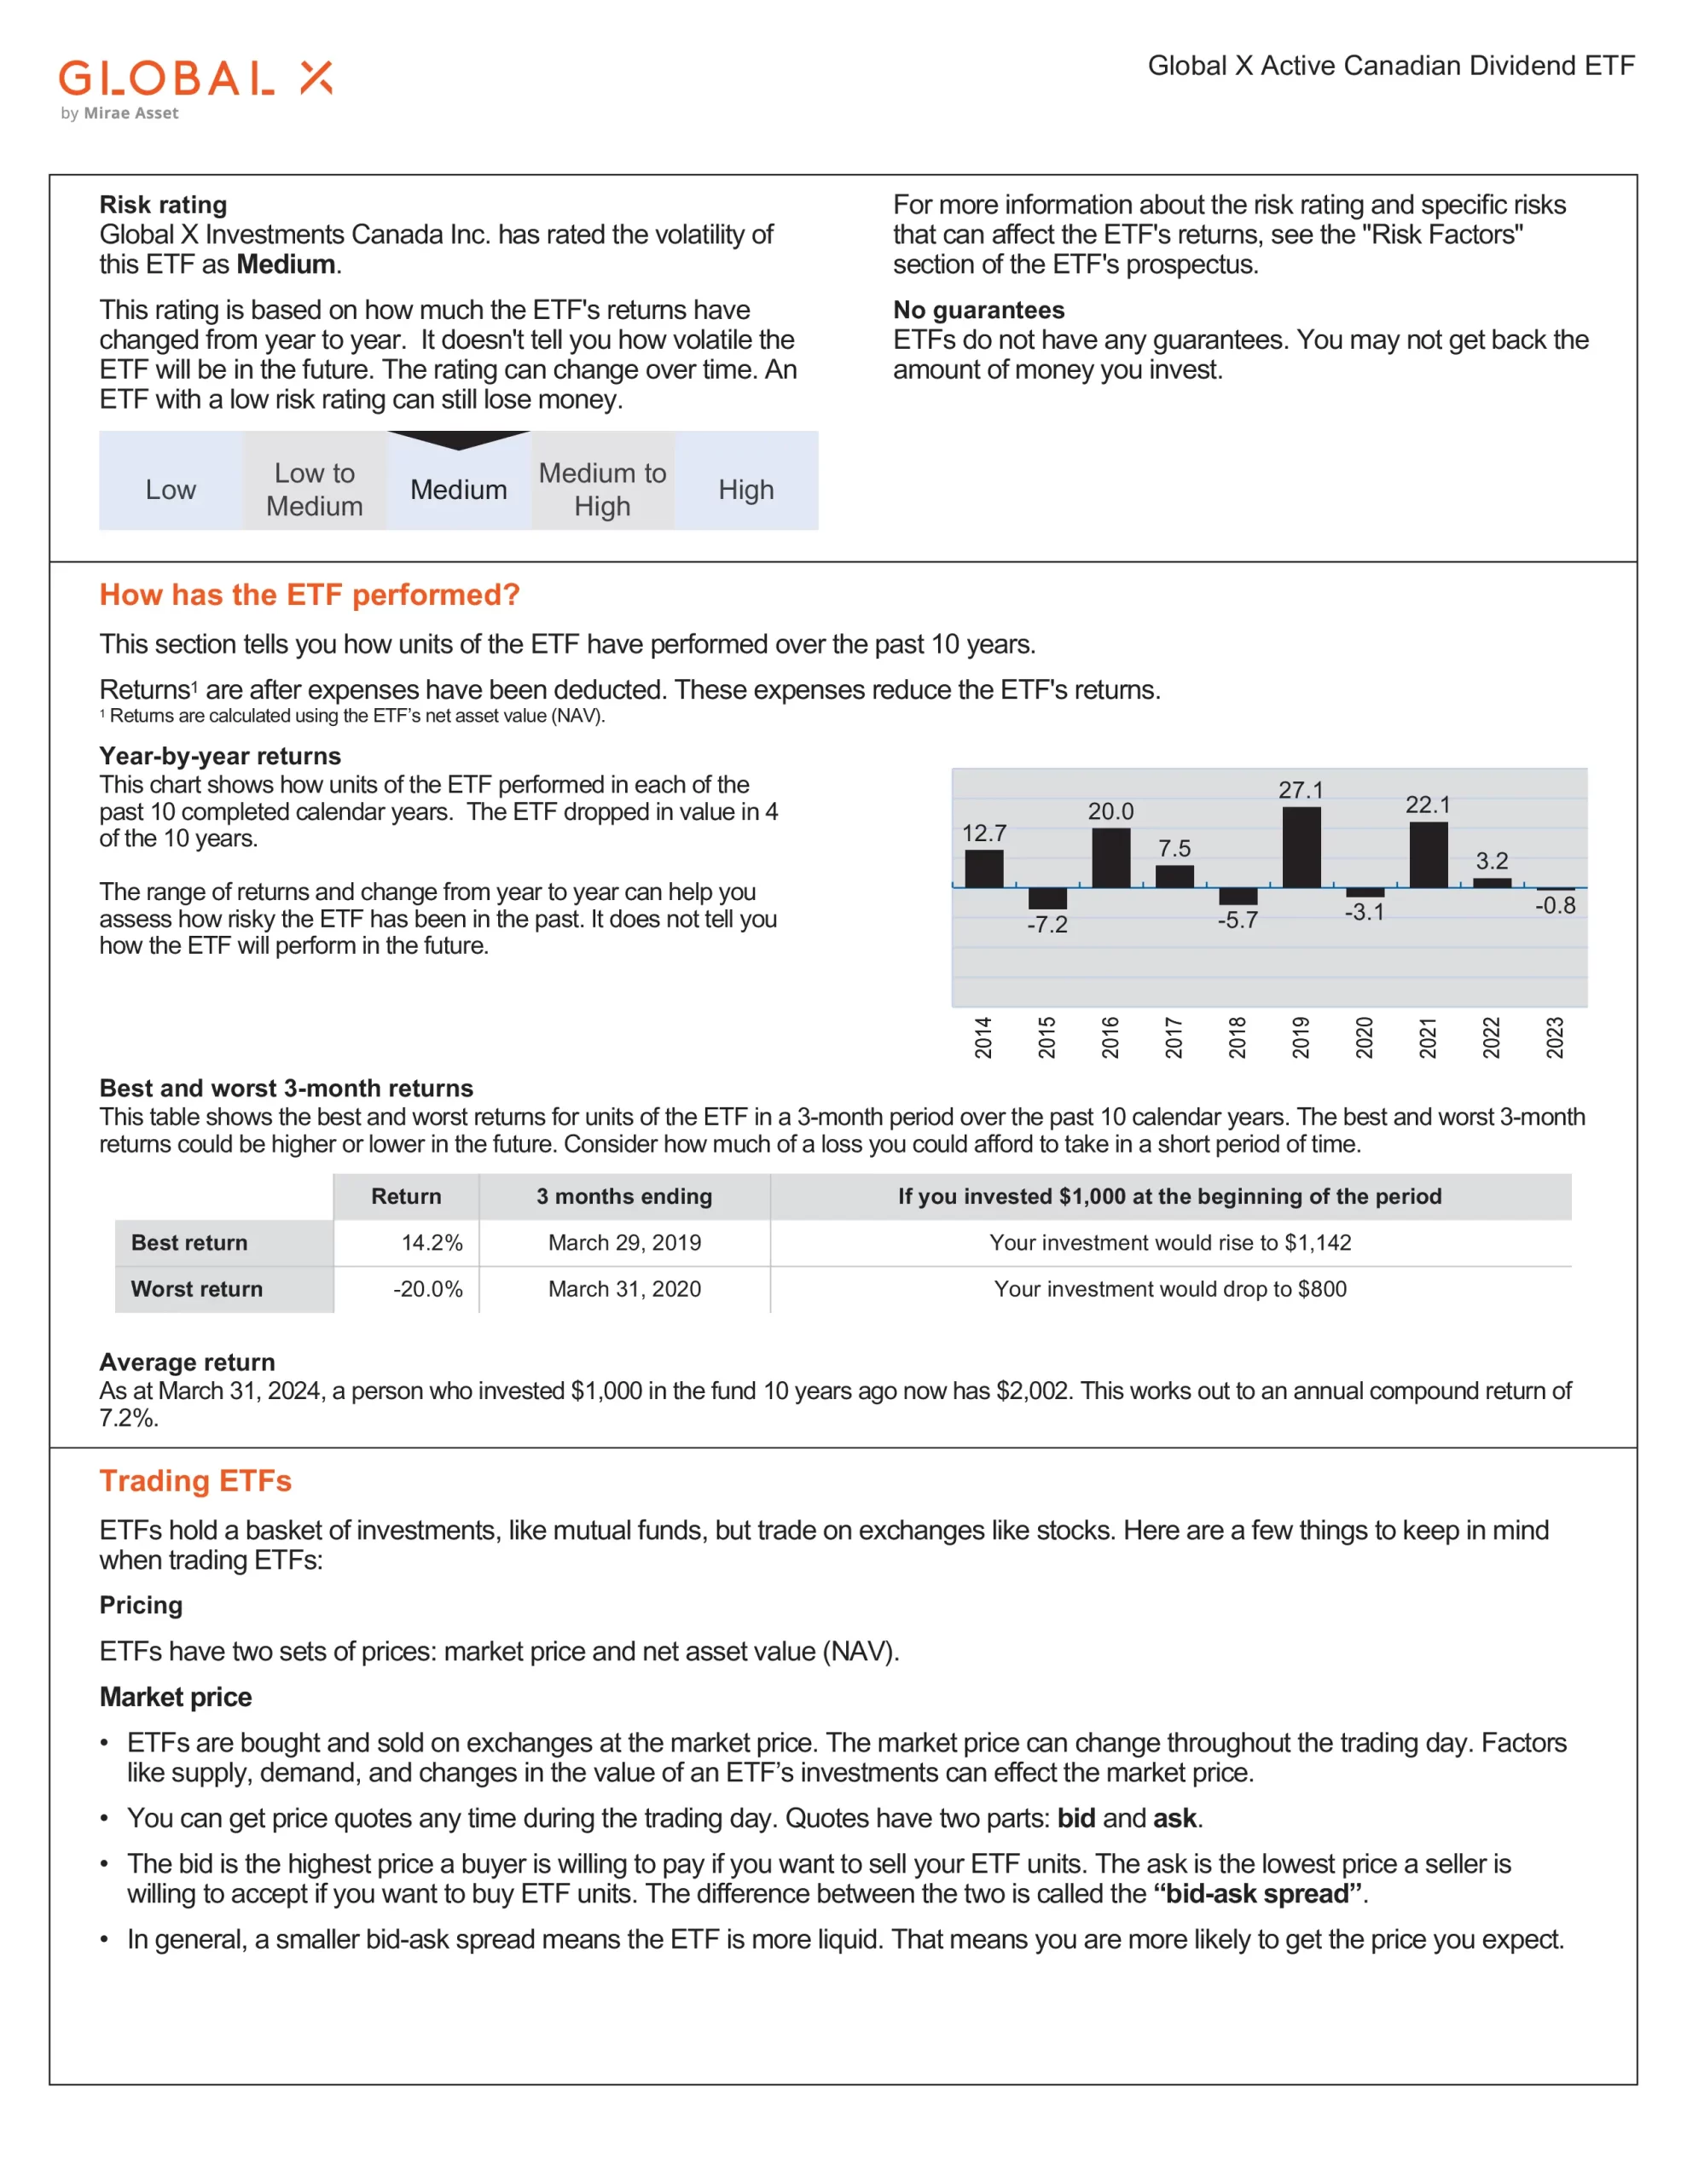
| Global X | HAL | Global X Active Canadian Dividend ETF | Medium | 2010-02-09 | $148,303,500 | 0.68% | 11.93 | 2.54% | 0.89 | Quarterly | 37 | 8.61% |
| Global X | HXH | Global X Canadian High Dividend Index Corporate Class ETF | Medium | 2016-04-08 | $148,303,500 | 0.11% | N/A | N/A | 0.86 | N/A | 24 | 10.73% |
| Hamilton | CMVP | Hamilton Champions Canadian Dividend Index ETF | Medium | N/A | N/A | N/A | N/A | N/A | N/A | N/A | N/A | N/A |
| Hamilton | CWIN | Hamilton Champions Enhanced Canadian Dividend ETF | Medium | N/A | N/A | N/A | N/A | N/A | N/A | N/A | N/A | N/A |
| Invesco | ICAE | Invesco S&P/TSX Canadian Dividend Aristocrats ESG Index ETF | Medium | 2023-02-23 | $7,922,555 | 0.23% | 17.86 | 3.51% | N/A | Monthly | 60 | N/A |
| Invesco | PDC | Invesco Canadian Dividend Index ETF | Medium | 2011-06-16 | $811,146,763 | 0.56% | 12.37 | 4.28% | 0.94 | Monthly | 45 | 8.88% |
| National Bank | NDIV | NBI Canadian Dividend Income ETF | Medium | 2021-02-11 | $15,910,000 | 0.61% | 19.72 | 2.47% | 0.84 | Monthly | 31 | N/A |
| RBC | RCD | RBC Quant Canadian Dividend Leaders ETF | Medium | 2014-01-15 | $189,430,000 | 0.43% | 15.29 | 3.30% | 0.91 | Monthly | 59 | 11.20% |
| RBC | RCDC | RBC Canadian Dividend Covered Call ETF | Medium | 2023-01-17 | $26,900,000 | 0.71% | 16.51 | 6.46% | N/A | Monthly | 82 | N/A |
| TD | TQCD | TD Q Canadian Dividend ETF | Medium | 2019-11-20 | $680,240,000 | 0.39% | 14.80 | 3.29% | 0.95 | Monthly | 62 | 10.57% |
| Vanguard | VDY | Vanguard FTSE Canadian High Dividend Yield Index ETF | Medium | 2012-11-02 | $3,320,000,000 | 0.22% | 12.45 | 4.25% | 0.94 | Monthly | 56 | 12.47% |
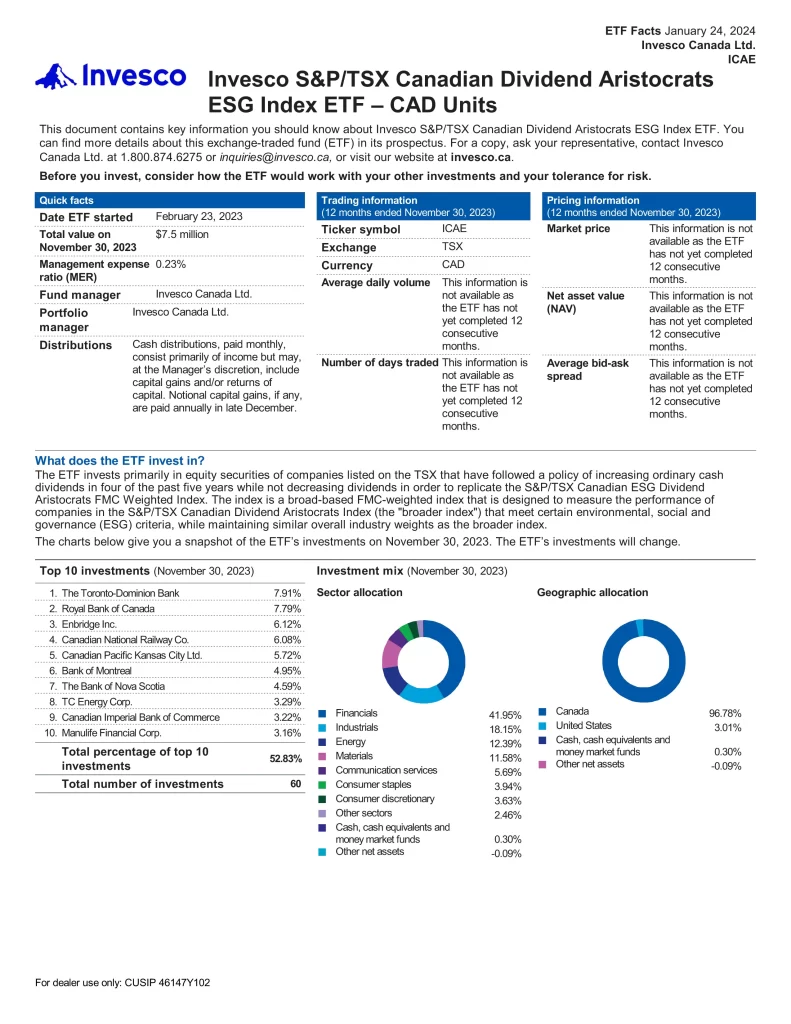
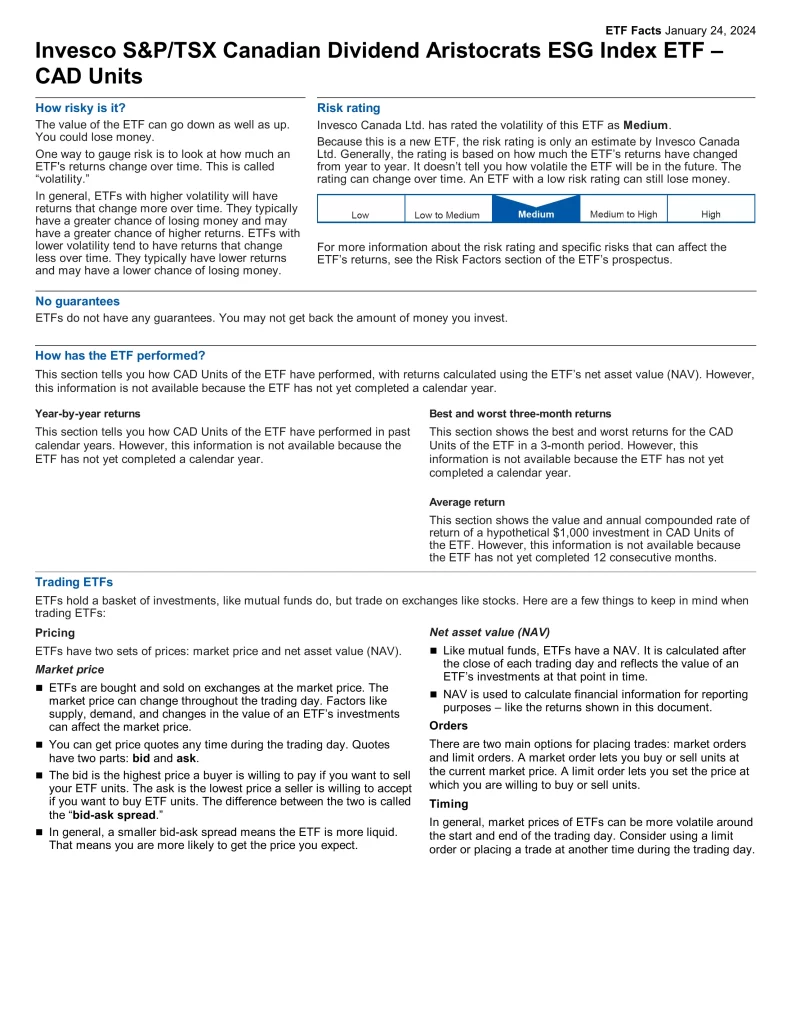
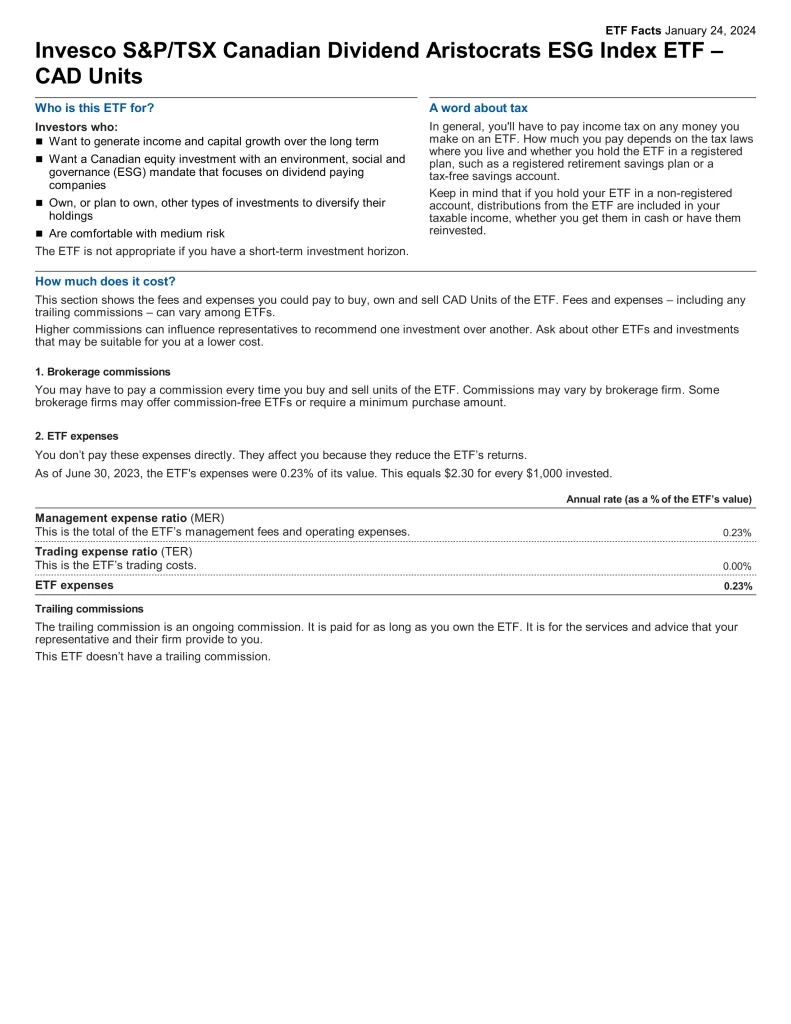
20. Invesco S&P/TSX Canadian Dividend Aristocrats ESG Index ETF
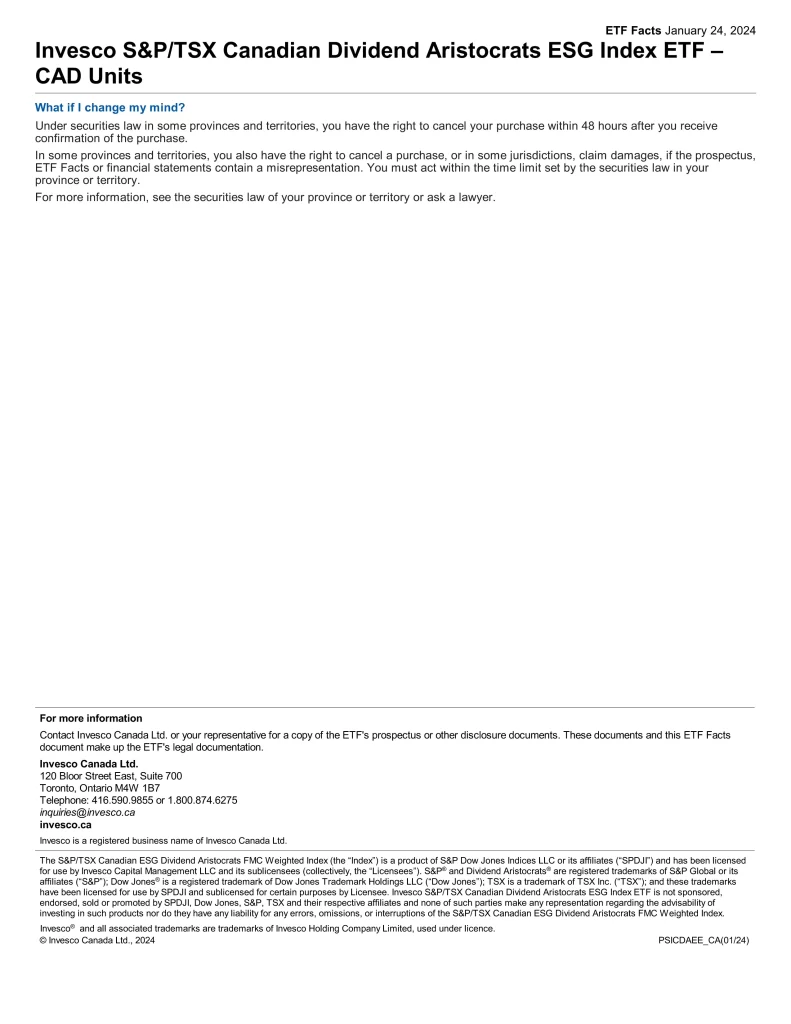
The Invesco S&P/TSX Canadian Dividend Aristocrats ESG Index ETF (ICAE) invests primarily in equity securities of companies listed on the TSX that have followed a policy of increasing ordinary cash dividends in four of the past five years while not decreasing dividends to replicate the S&P/TSX Canadian ESG Dividend Aristocrats FMC Weighted Index. The index is a broad-based FMC-weighted index that is designed to measure the performance of companies in the S&P/TSX Canadian Dividend Aristocrats Index that meet certain environmental, social and governance (ESG) criteria while maintaining similar overall industry weights as the broader index.
19. RBC Canadian Dividend Covered Call ETF
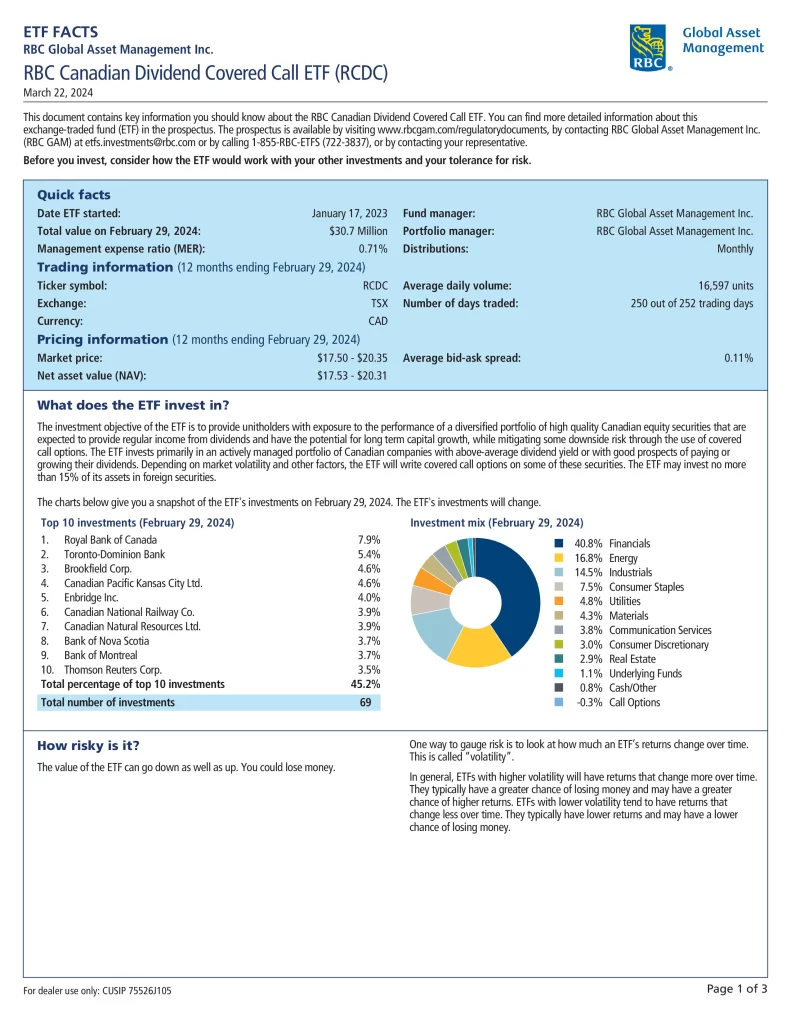
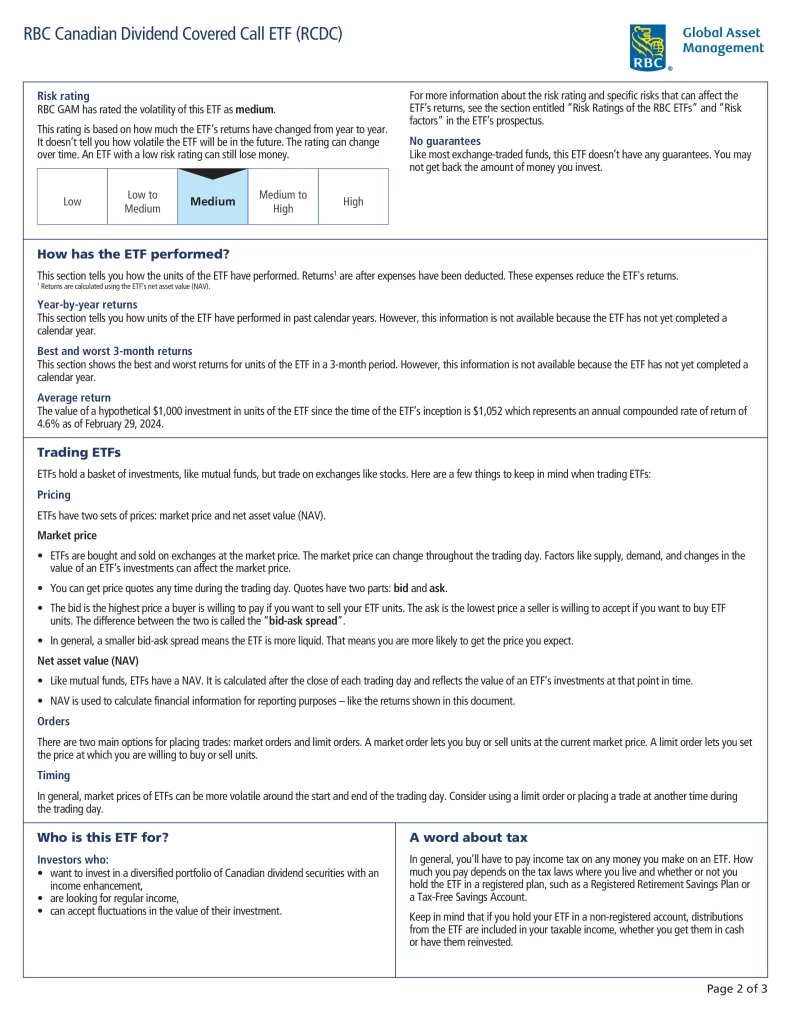
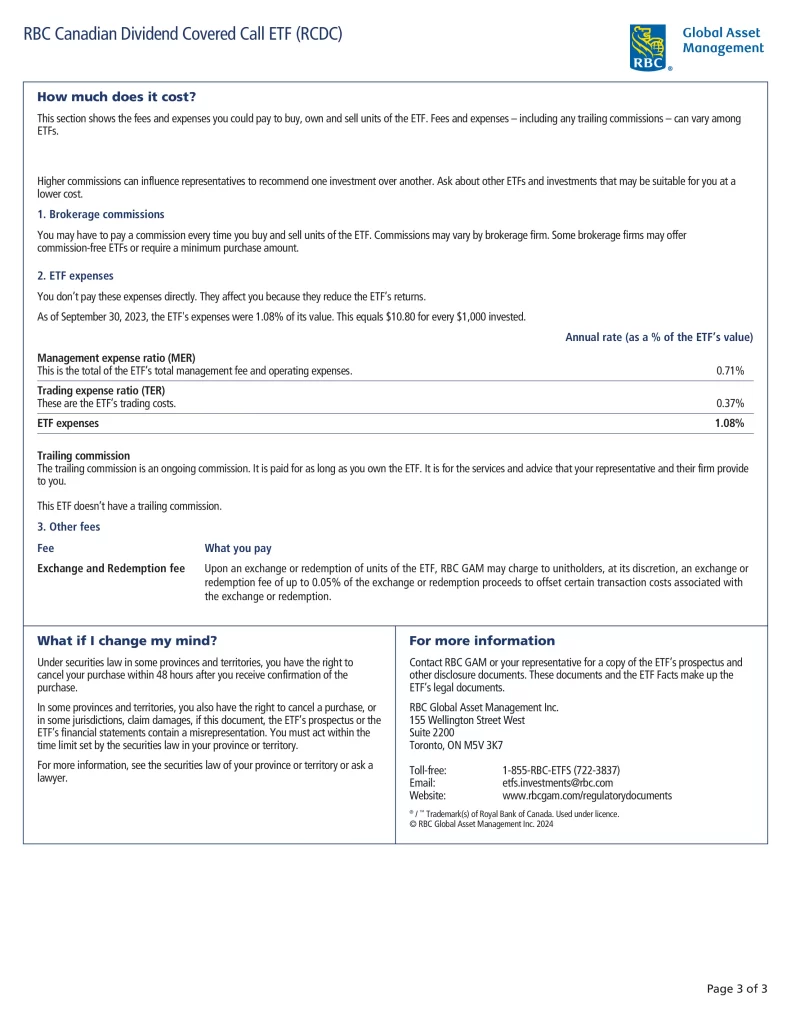
The investment objective of the RBC Canadian Dividend Covered Call ETF (RCDC) is to provide unitholders with exposure to the performance of a diversified portfolio of high-quality Canadian equity securities that are expected to provide regular income from dividends and have the potential for long-term capital growth while mitigating some downside risk through the use of covered call options. The ETF invests primarily in an actively managed portfolio of Canadian companies with above-average dividend yield or with good prospects of paying or growing their dividends. Depending on market volatility and other factors, the ETF will write covered call options on some of these securities. The ETF may invest no more than 15% of its assets in foreign securities.
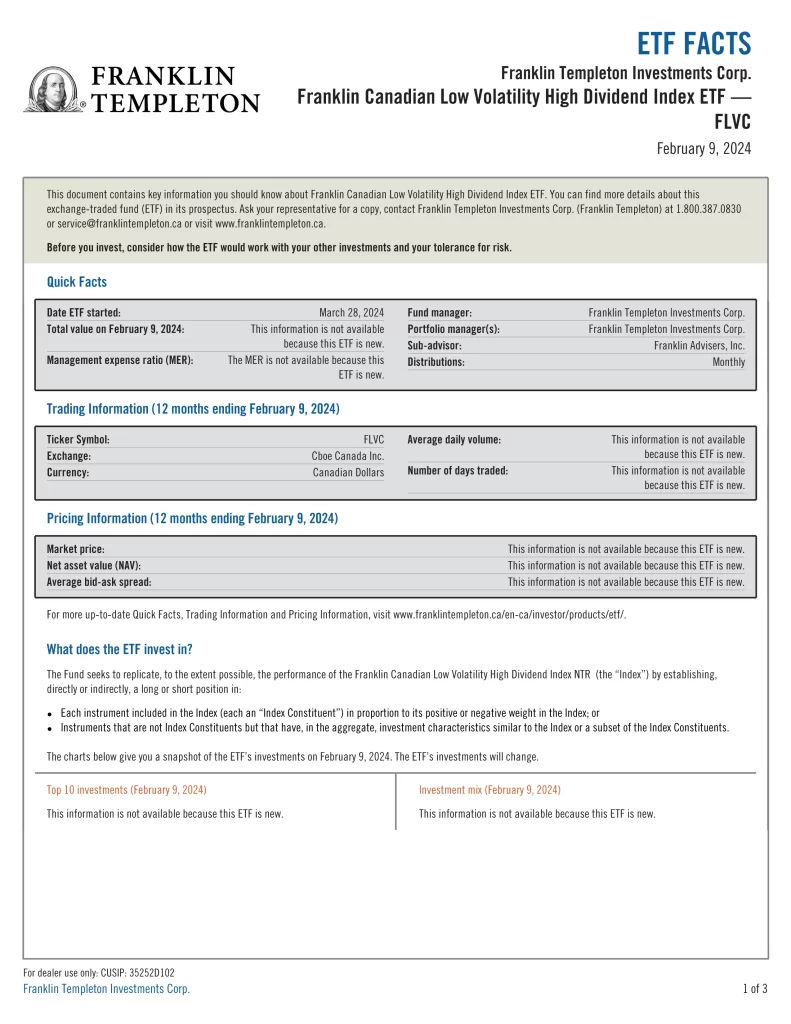
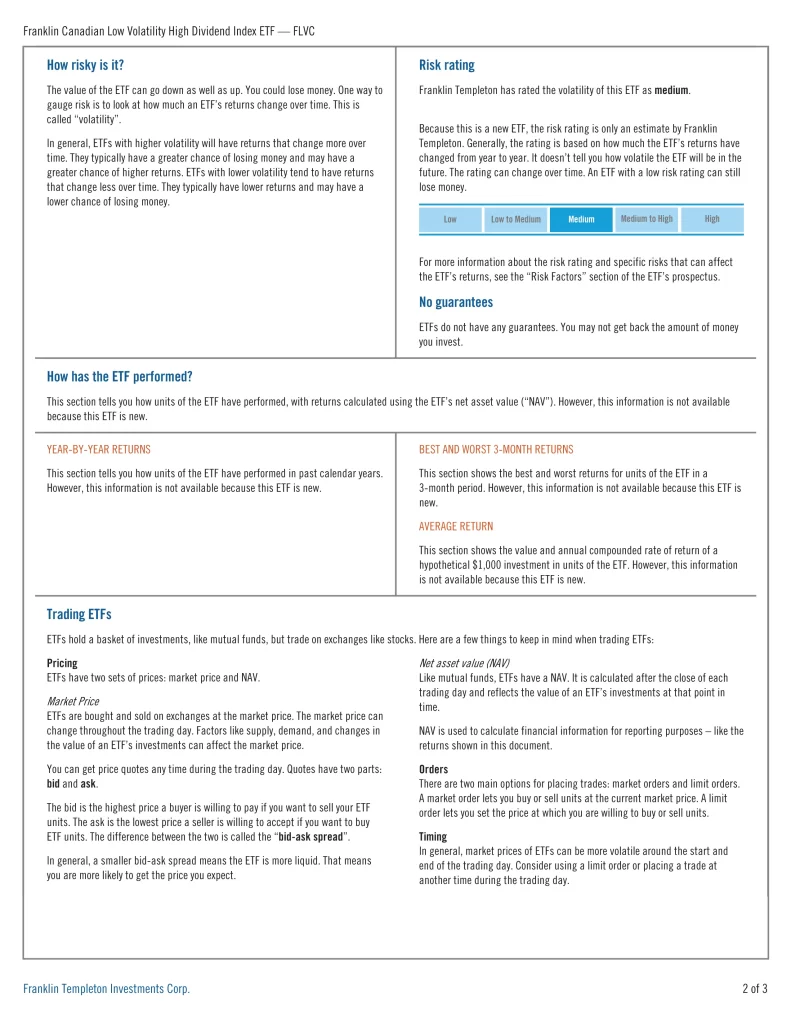
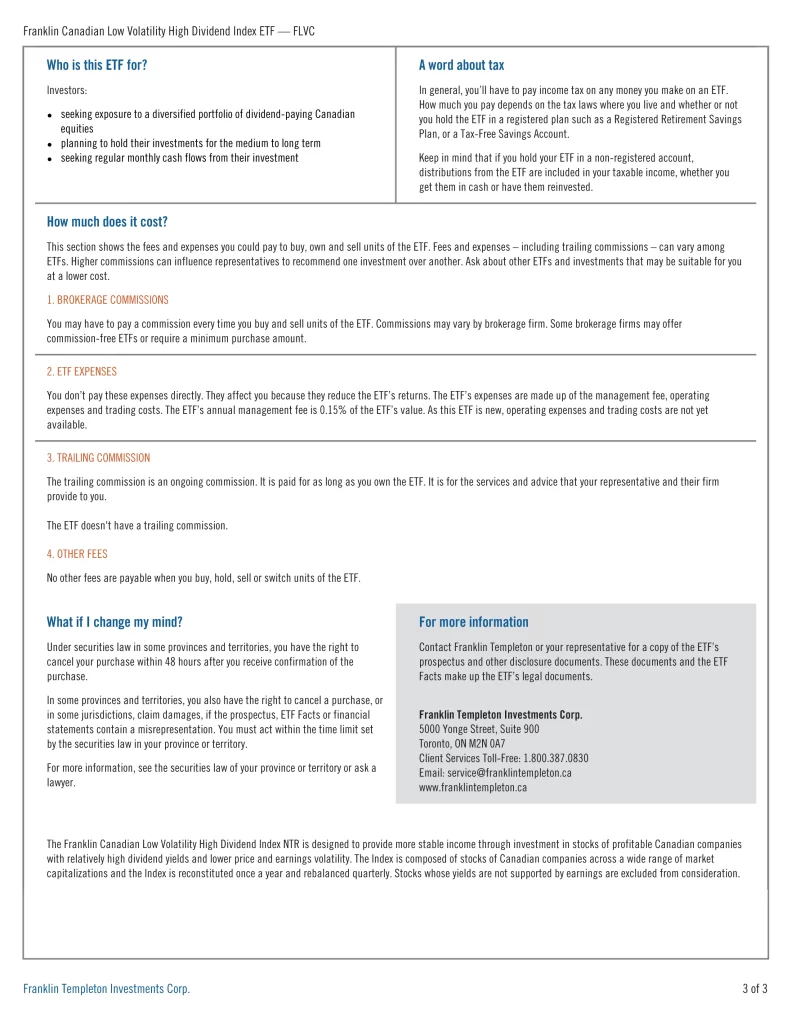
18. Franklin Canadian Low Volatility High Dividend Index ETF
Franklin Canadian Low Volatility High Dividend Index ETF (FLVC) seeks to replicate the performance of the Franklin Canadian Low Volatility High Dividend Index NTR by establishing, directly or indirectly, a long or short position in:
- Instruments that are not Index Constituents but that have, in the aggregate, investment characteristics similar to the Index or a subset of the Index Constituents
- Each instrument included in the Index in proportion to its positive or negative weight in the Index
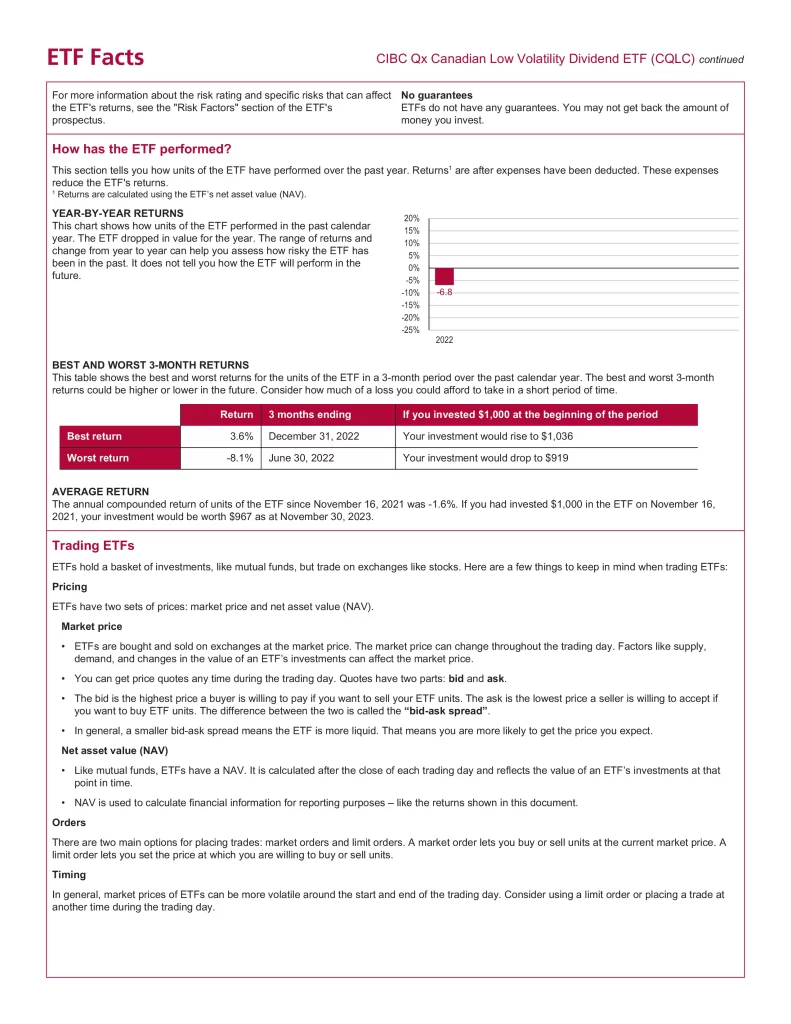
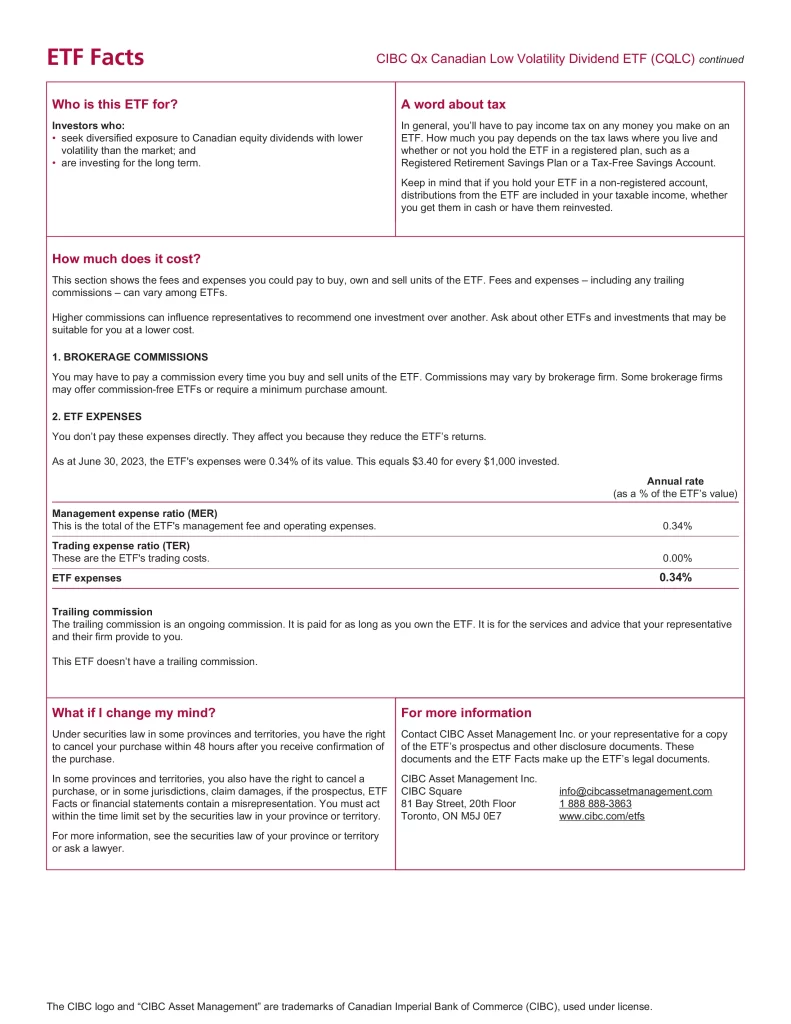
17. CIBC Qx Canadian Low Volatility Dividend ETF
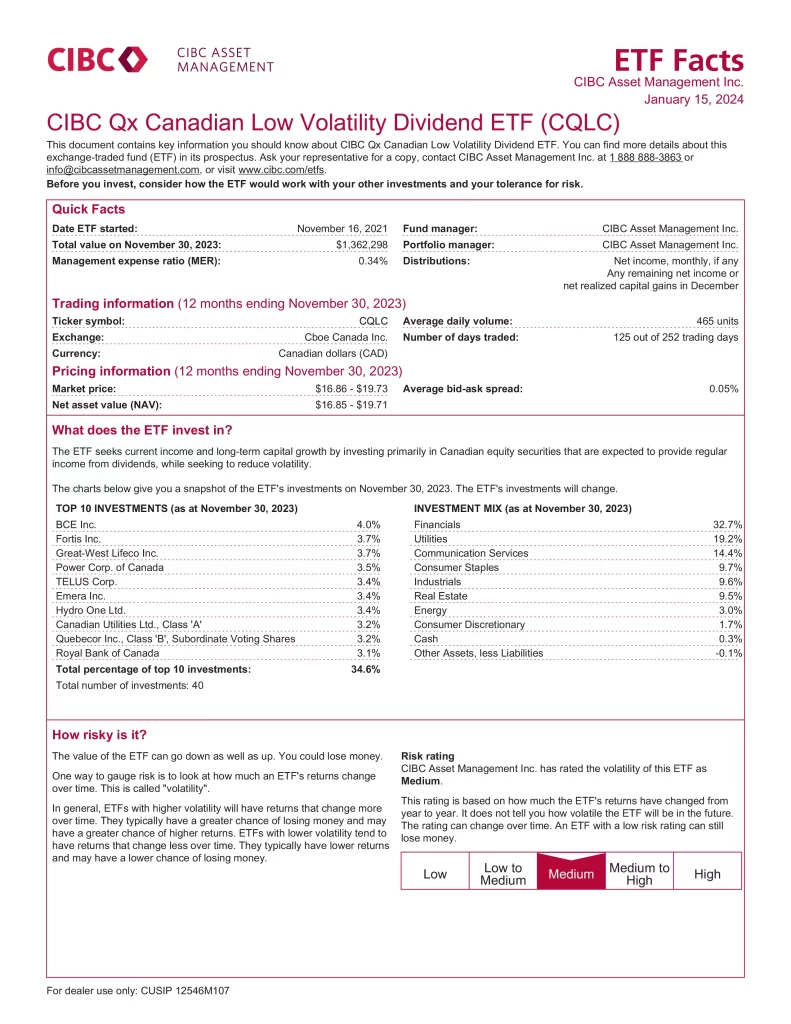
CIBC Qx Canadian Low Volatility Dividend ETF (CQLC) seeks current income and long-term capital growth by investing primarily in Canadian equity securities that are expected to provide regular income from dividends while seeking to reduce volatility.
- Benefit from an investment management approach that is grounded in data science with systemic rebalancing, ensuring that manager bias does not impact portfolios
- Enjoy a steady stream of regular income
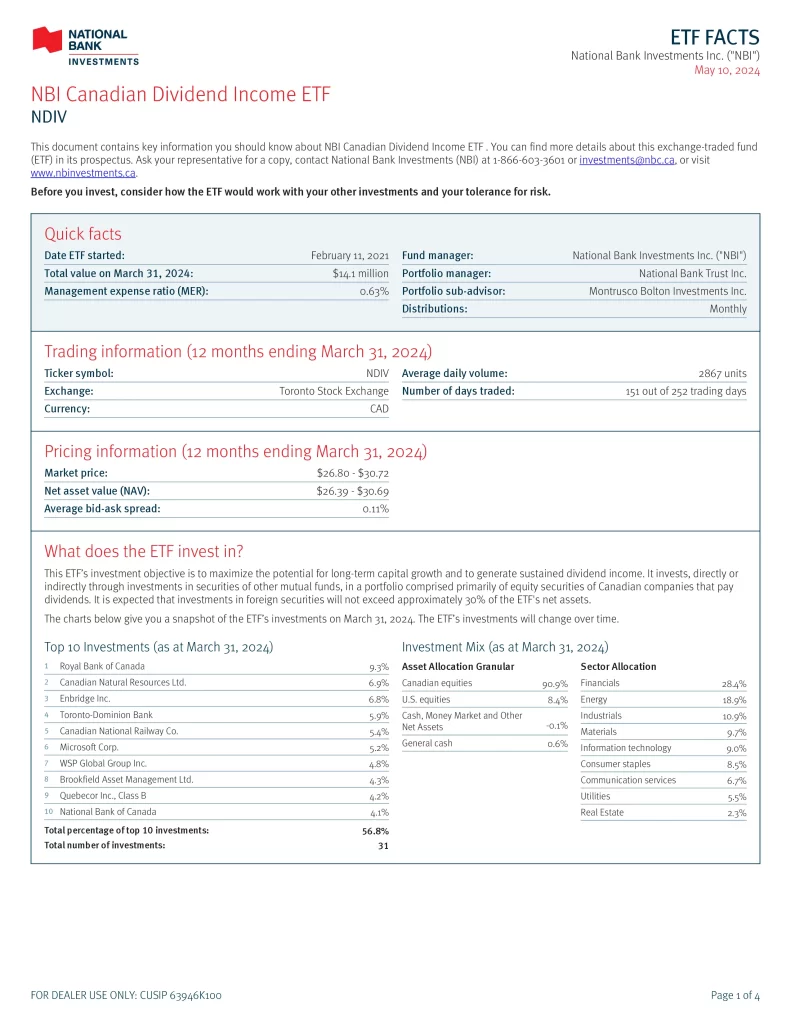
16. NBI Canadian Dividend Income ETF
NBI Canadian Dividend Income ETF (NDIV) seeks to maximize the potential for long-term capital growth and to generate sustained dividend income. It invests, directly or indirectly through investments in securities of other mutual funds, in a portfolio comprised primarily of equity securities of Canadian companies that pay dividends. It is expected that investments in foreign securities will not exceed approximately 30% of the ETF’s net assets.
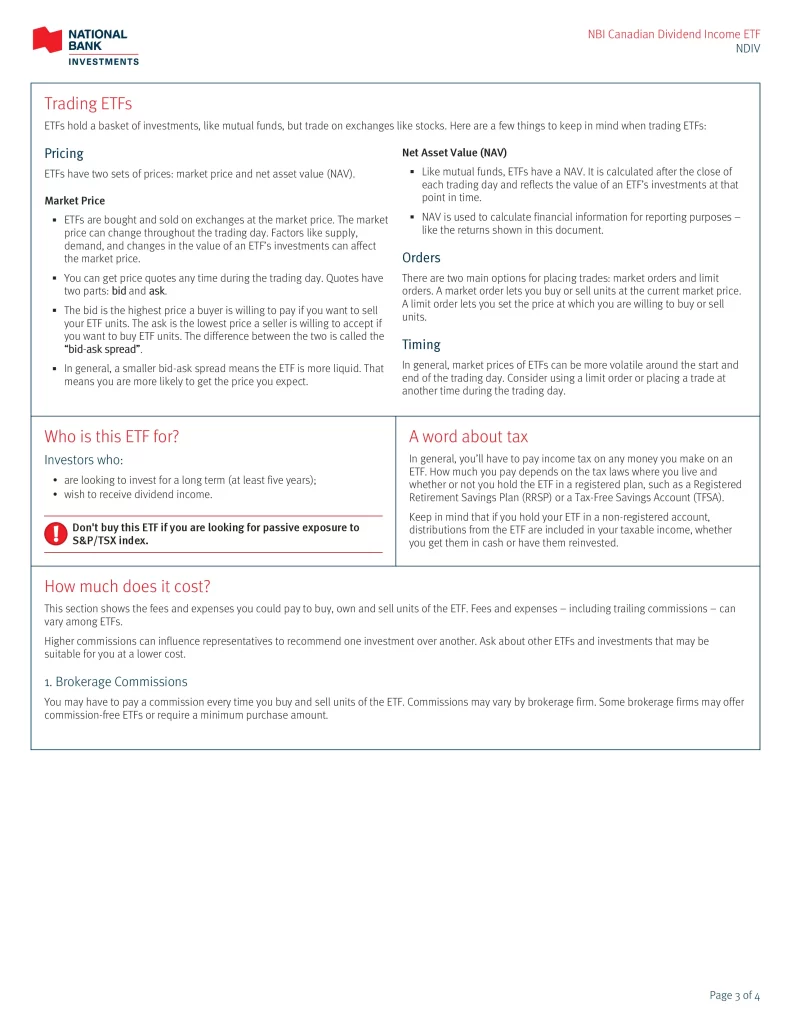
- Don’t buy this ETF if you are looking for passive exposure to the S&P/TSX index
- Are looking to invest for the long term (at least five years)
- Wish to receive dividend income

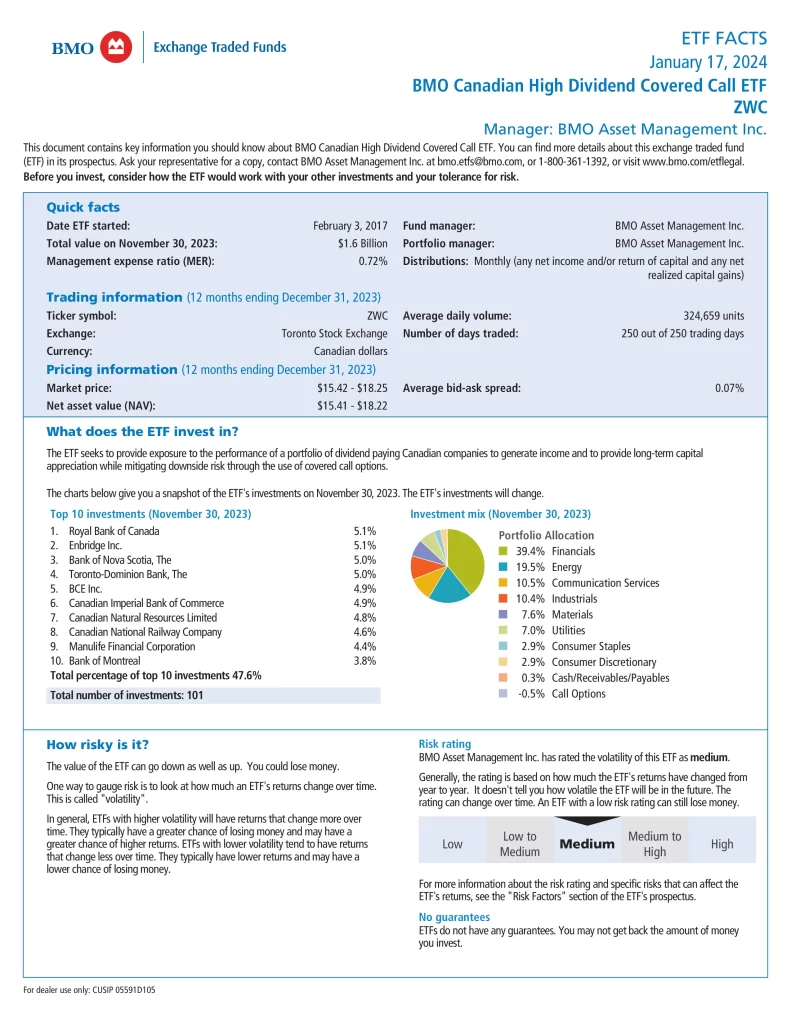
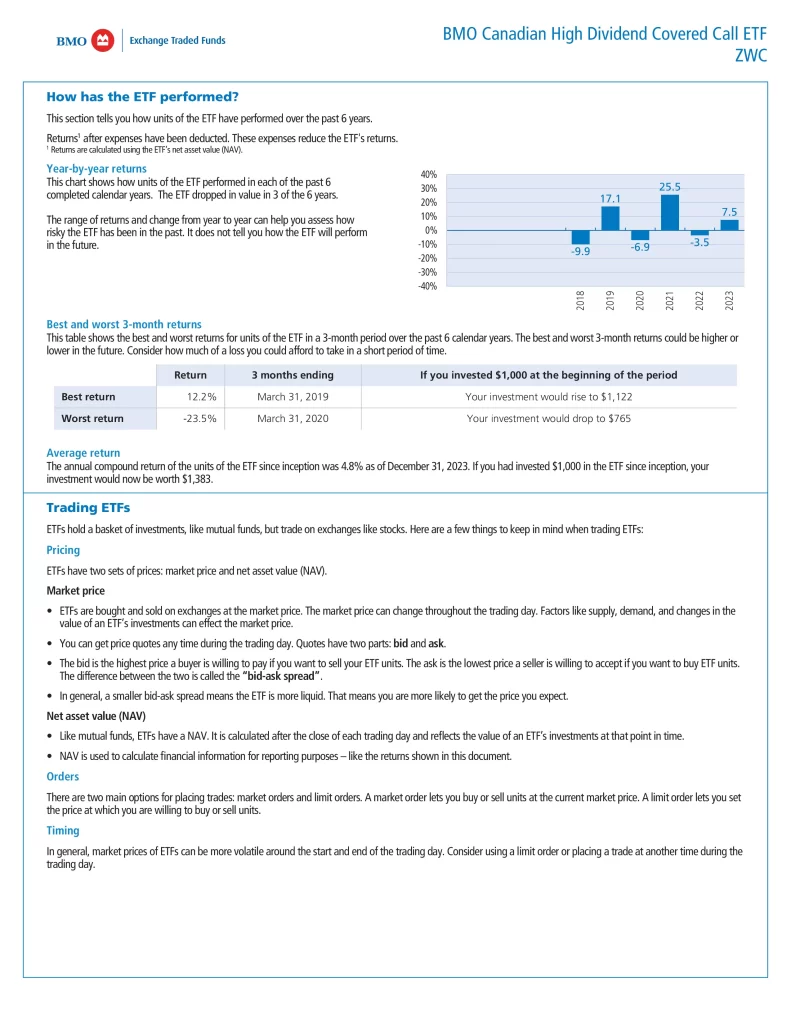
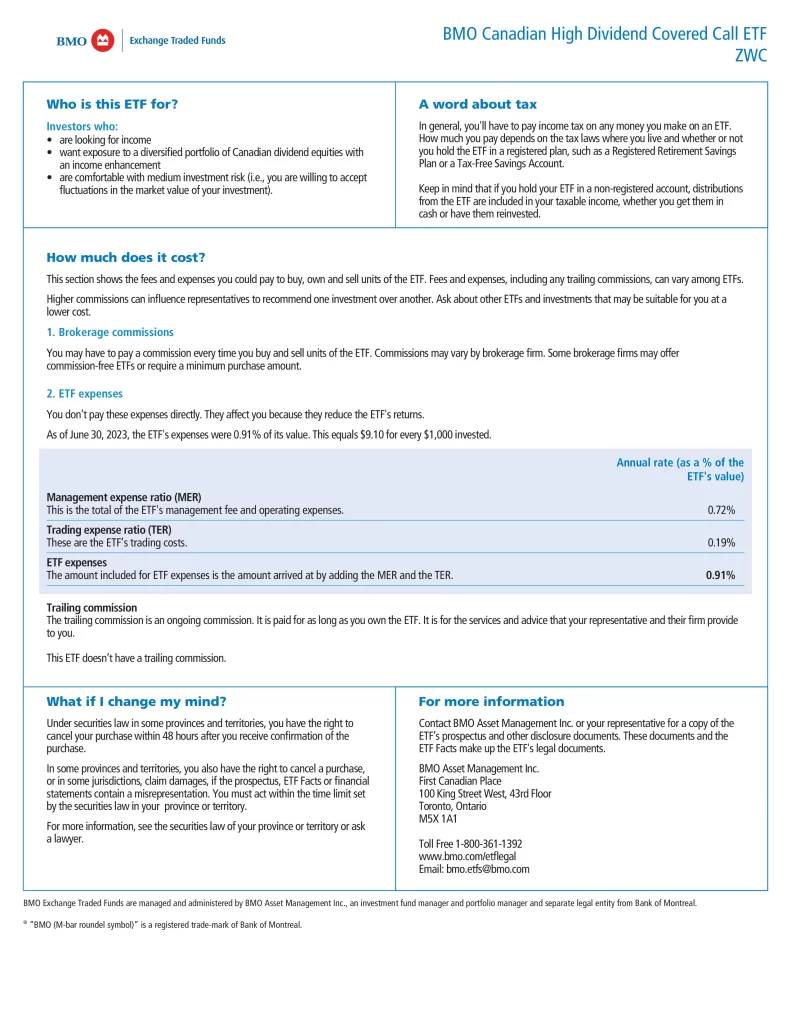
15. BMO Canadian High Dividend Covered Call ETF
BMO Canadian High Dividend Covered Call ETF (ZWC) seeks to provide exposure to the performance of a portfolio of dividend-paying Canadian companies to generate income and provide long-term capital appreciation while mitigating downside risk through the use of covered call options. ZWC has been designed to provide exposure to a dividend-focused portfolio while earning call option premiums. The underlying portfolio is yield-weighted and broadly diversified across sectors. The Fund utilizes a rules-based methodology that considers dividend growth rate, yield, and payout ratio. Securities will also be subject to a liquidity screening process. The ETF also dynamically writes covered call options. The call options are written out of the money and selected based on analyzing the option’s available premium. The option premium provides limited downside protection.
- Designed for investors looking for higher income from equity portfolios
- Invested in a diversified portfolio of high-dividend Canadian companies
- Call option writing reduces volatility
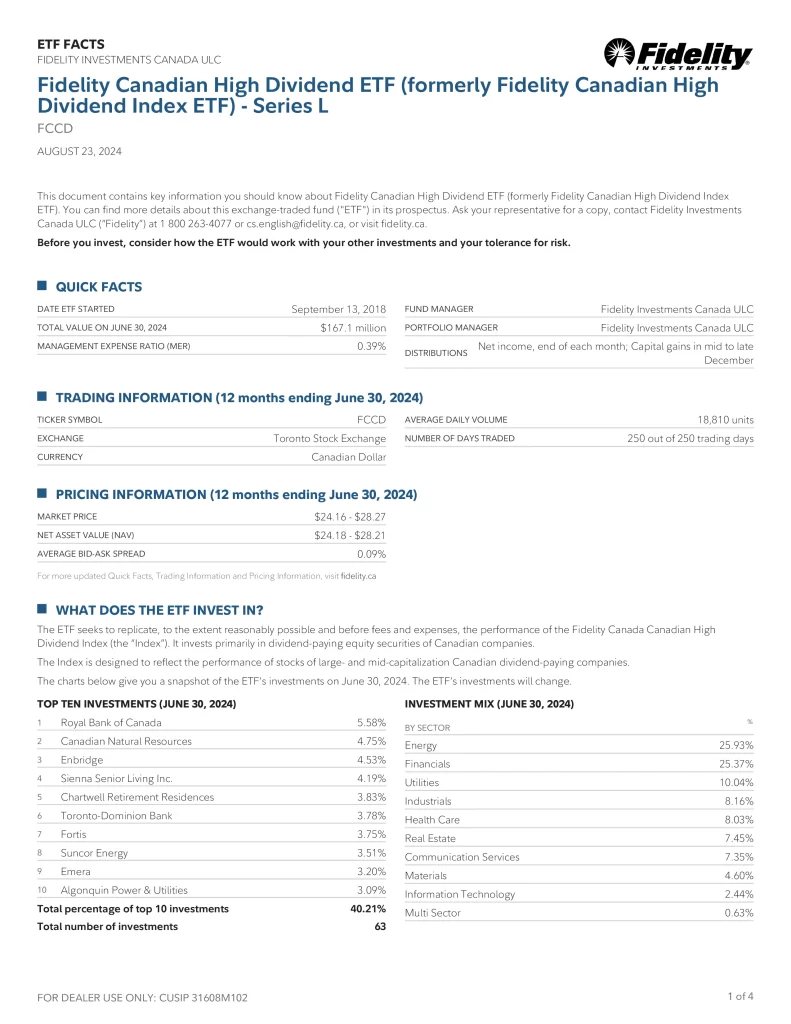
14. Fidelity Canadian High Dividend ETF
Fidelity Canadian High Dividend ETF (FCCD) seeks to replicate the performance of the Fidelity Canada Canadian High Dividend Index. It invests primarily in dividend-paying equity securities of Canadian companies. The Index is designed to reflect the performance of stocks of large- and mid-capitalization Canadian dividend-paying companies.
- Single-factor exposure to high-quality tax-preferred Canadian dividend-paying companies
- An outcome-oriented approach that seeks to deliver monthly income and capital gains
- An efficient complement to a well-diversified portfolio
13. Global X Active Canadian Dividend ETF
Global X Active Canadian Dividend ETF (HAL) seeks long-term total returns consisting of regular dividend income and long-term capital growth. HAL invests primarily in equity securities of North American companies with above-average dividend yields.
- Dividend Income Focus: Aims to provide investors with regular dividend income by selecting some of Canada’s best dividend-paying companies that exhibit a consistent pattern of growing dividends, offering a potential source of steady cash flow through all market cycles.
- Proprietary Stock Selection: Guardian’s proprietary GPS Stock Selection Process targets dividend stocks that offer a combination of Growth of dividends, Payout of cash flow, and Sustainability of the payout profile.
- Active Management: Sub-advised by Guardian Capital, HAL is actively managed to navigate all market cycles by identifying a broader range of opportunities compared to an approach that focuses on yield alone.
12. Invesco Canadian Dividend Index ETF
Invesco Canadian Dividend Index ETF (PDC) invests in dividend-paying securities of Canadian companies to replicate the NASDAQ Select Canadian Dividend Index, which is comprised of companies that are listed on the Toronto Stock Exchange and have had stable or increasing annual regular dividend payments for the past five or more consecutive years.


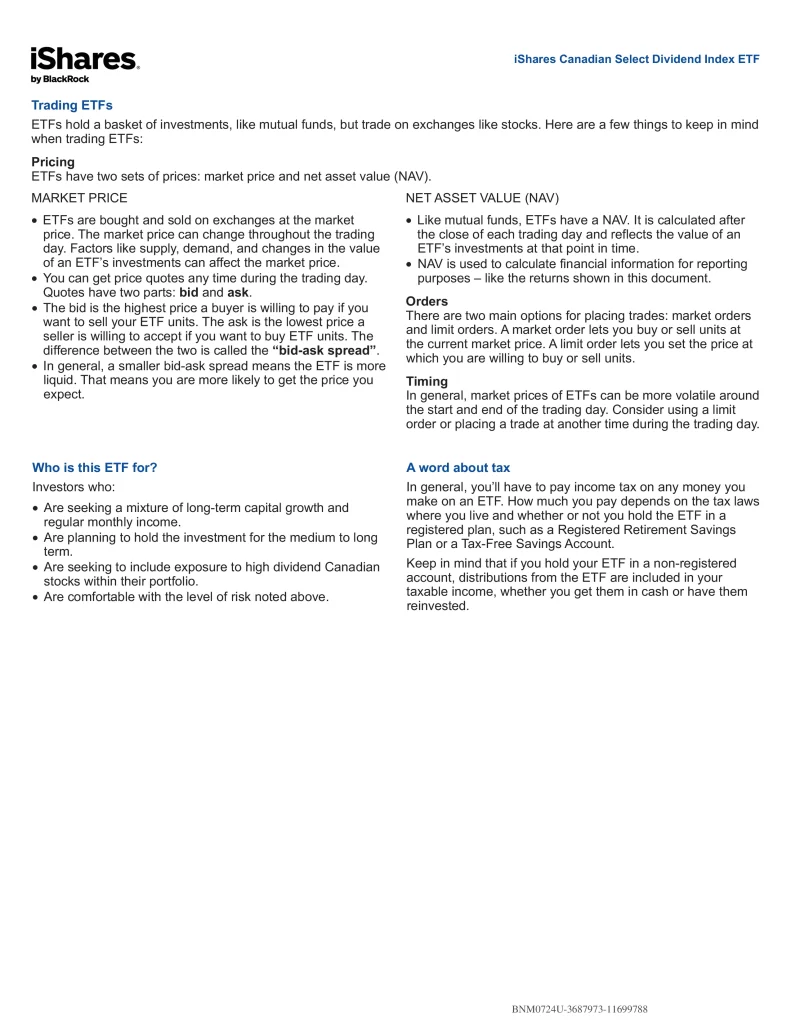
11. iShares Canadian Select Dividend Index ETF
iShares Canadian Select Dividend Index ETF (XDV) seeks to provide long-term capital growth by replicating the performance of the Dow Jones Canada Select Dividend Index.
- Diversified exposure to 30 of the highest-yielding Canadian companies in the Dow Jones Canada Total Market Index
- Rules-based methodology analyses stocks by dividend growth, yield and payout ratio
- Earn regular monthly dividend income
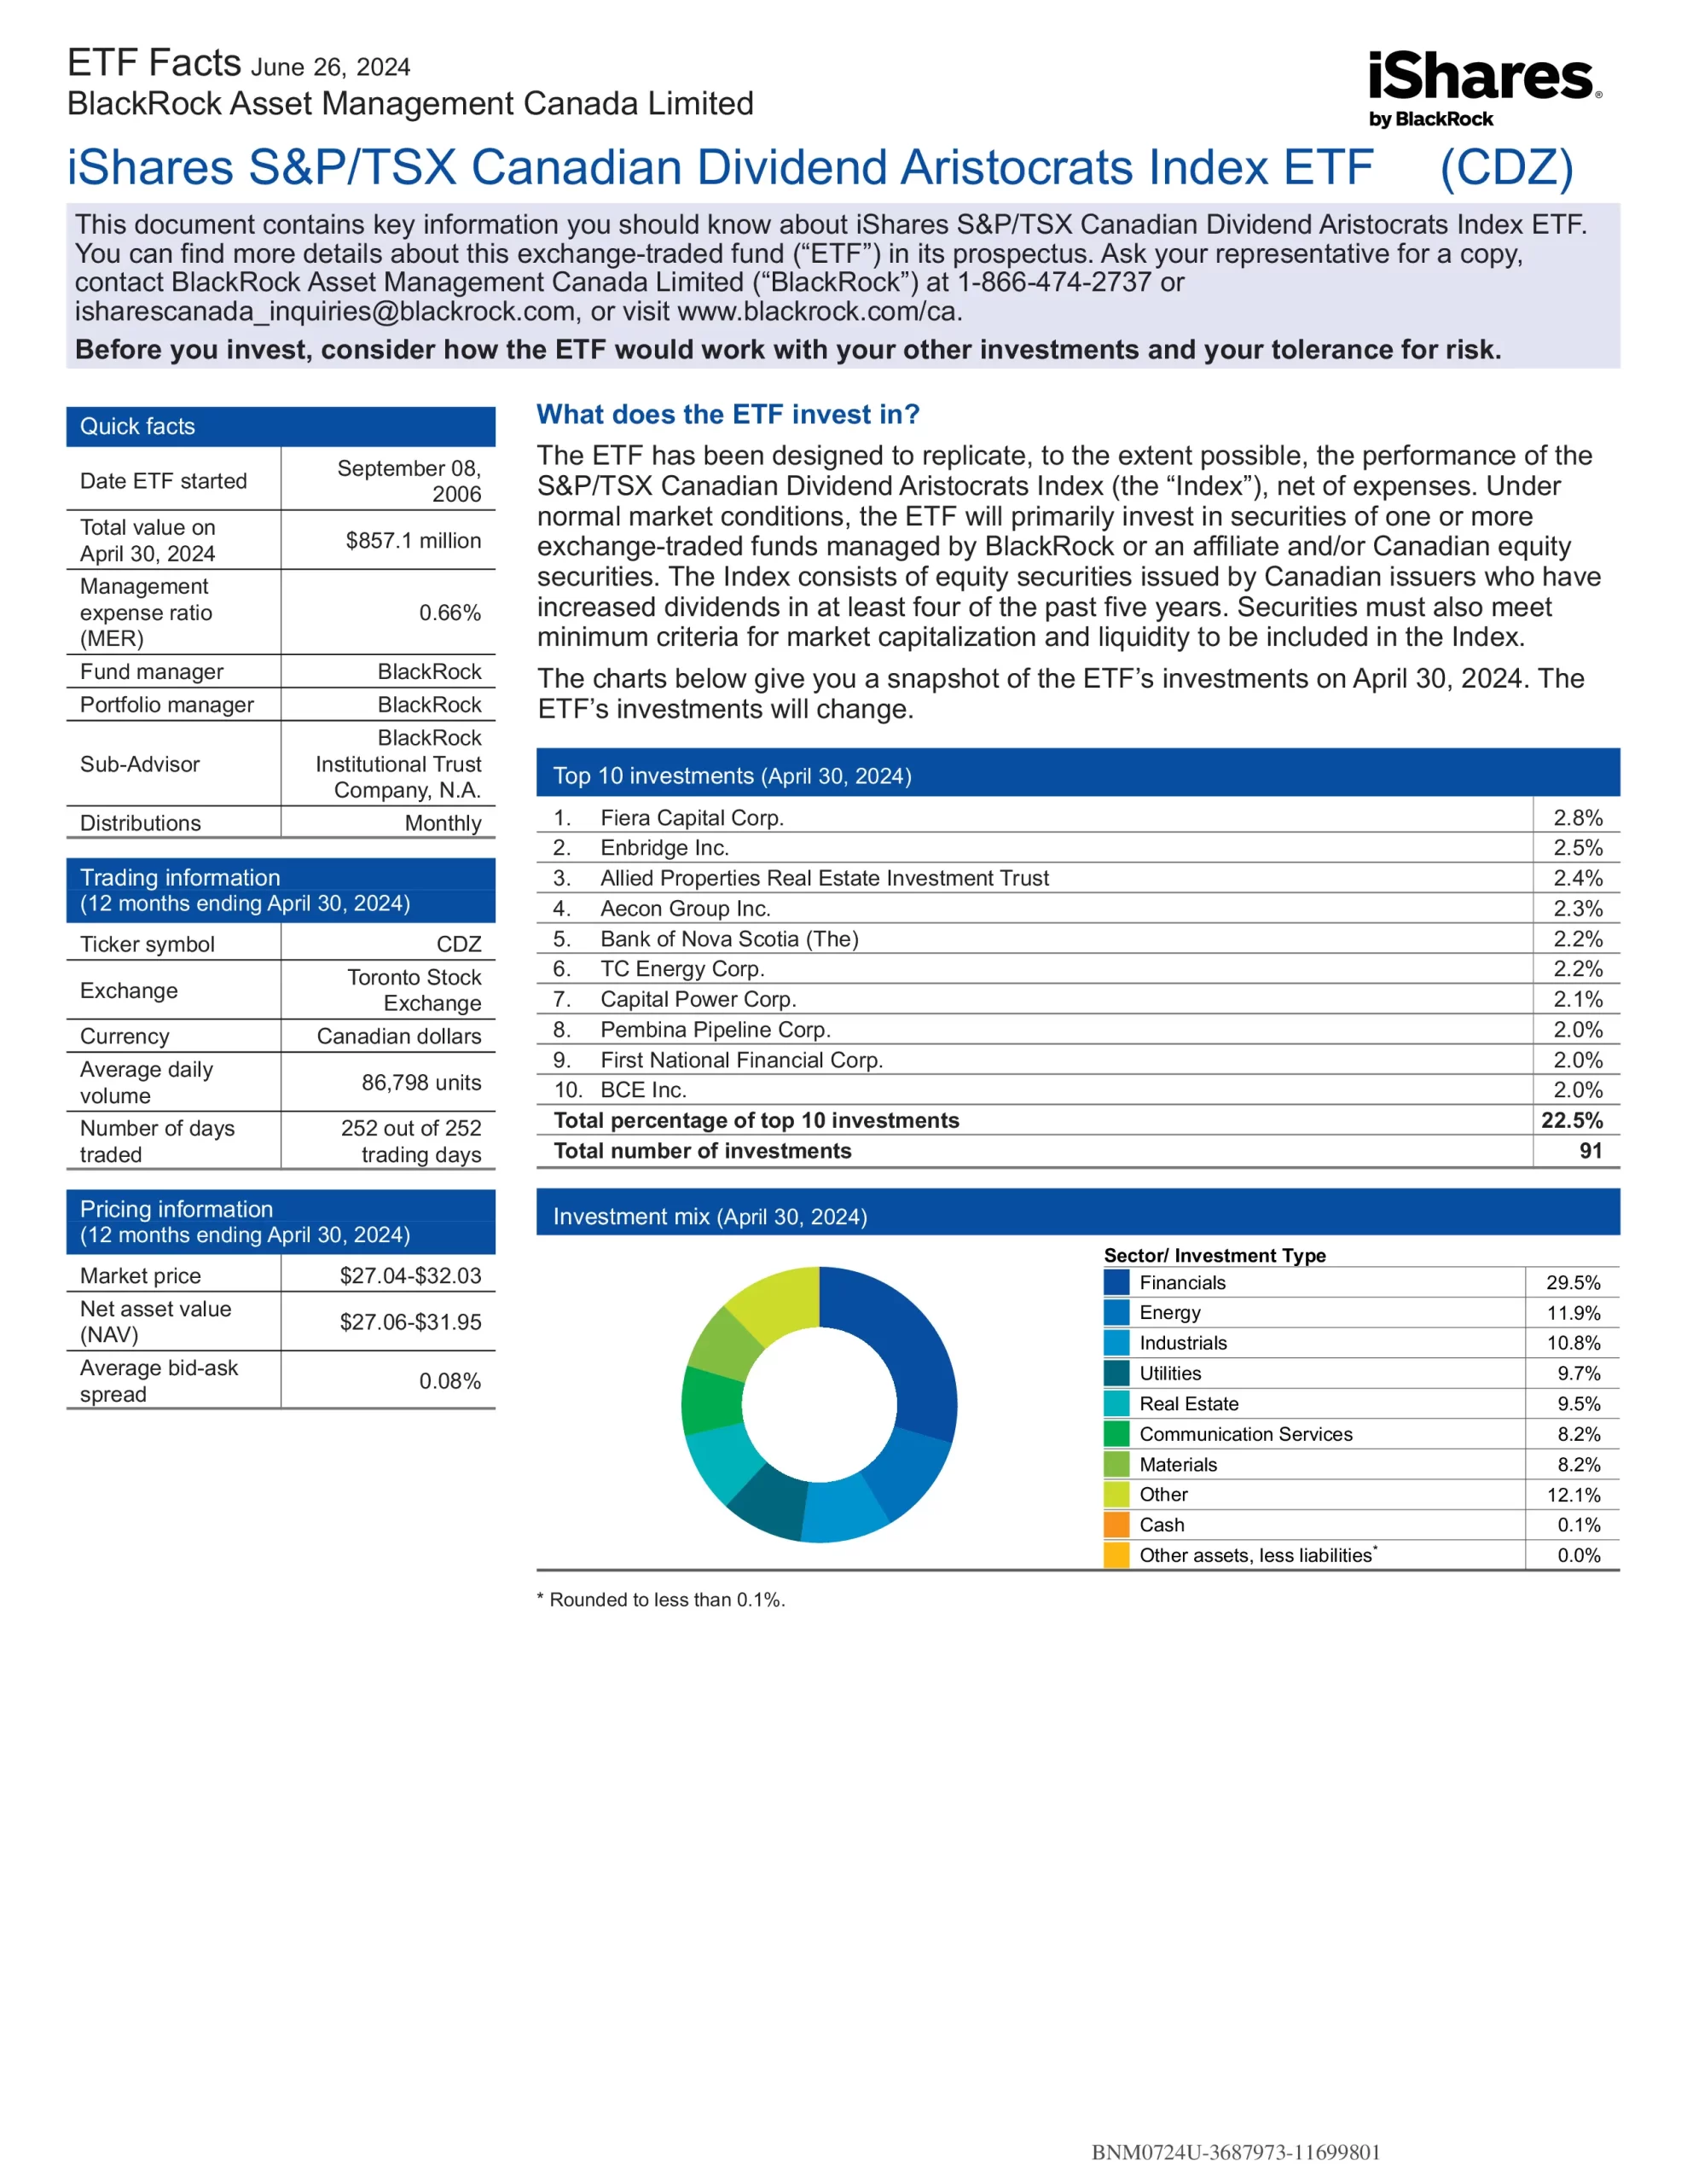
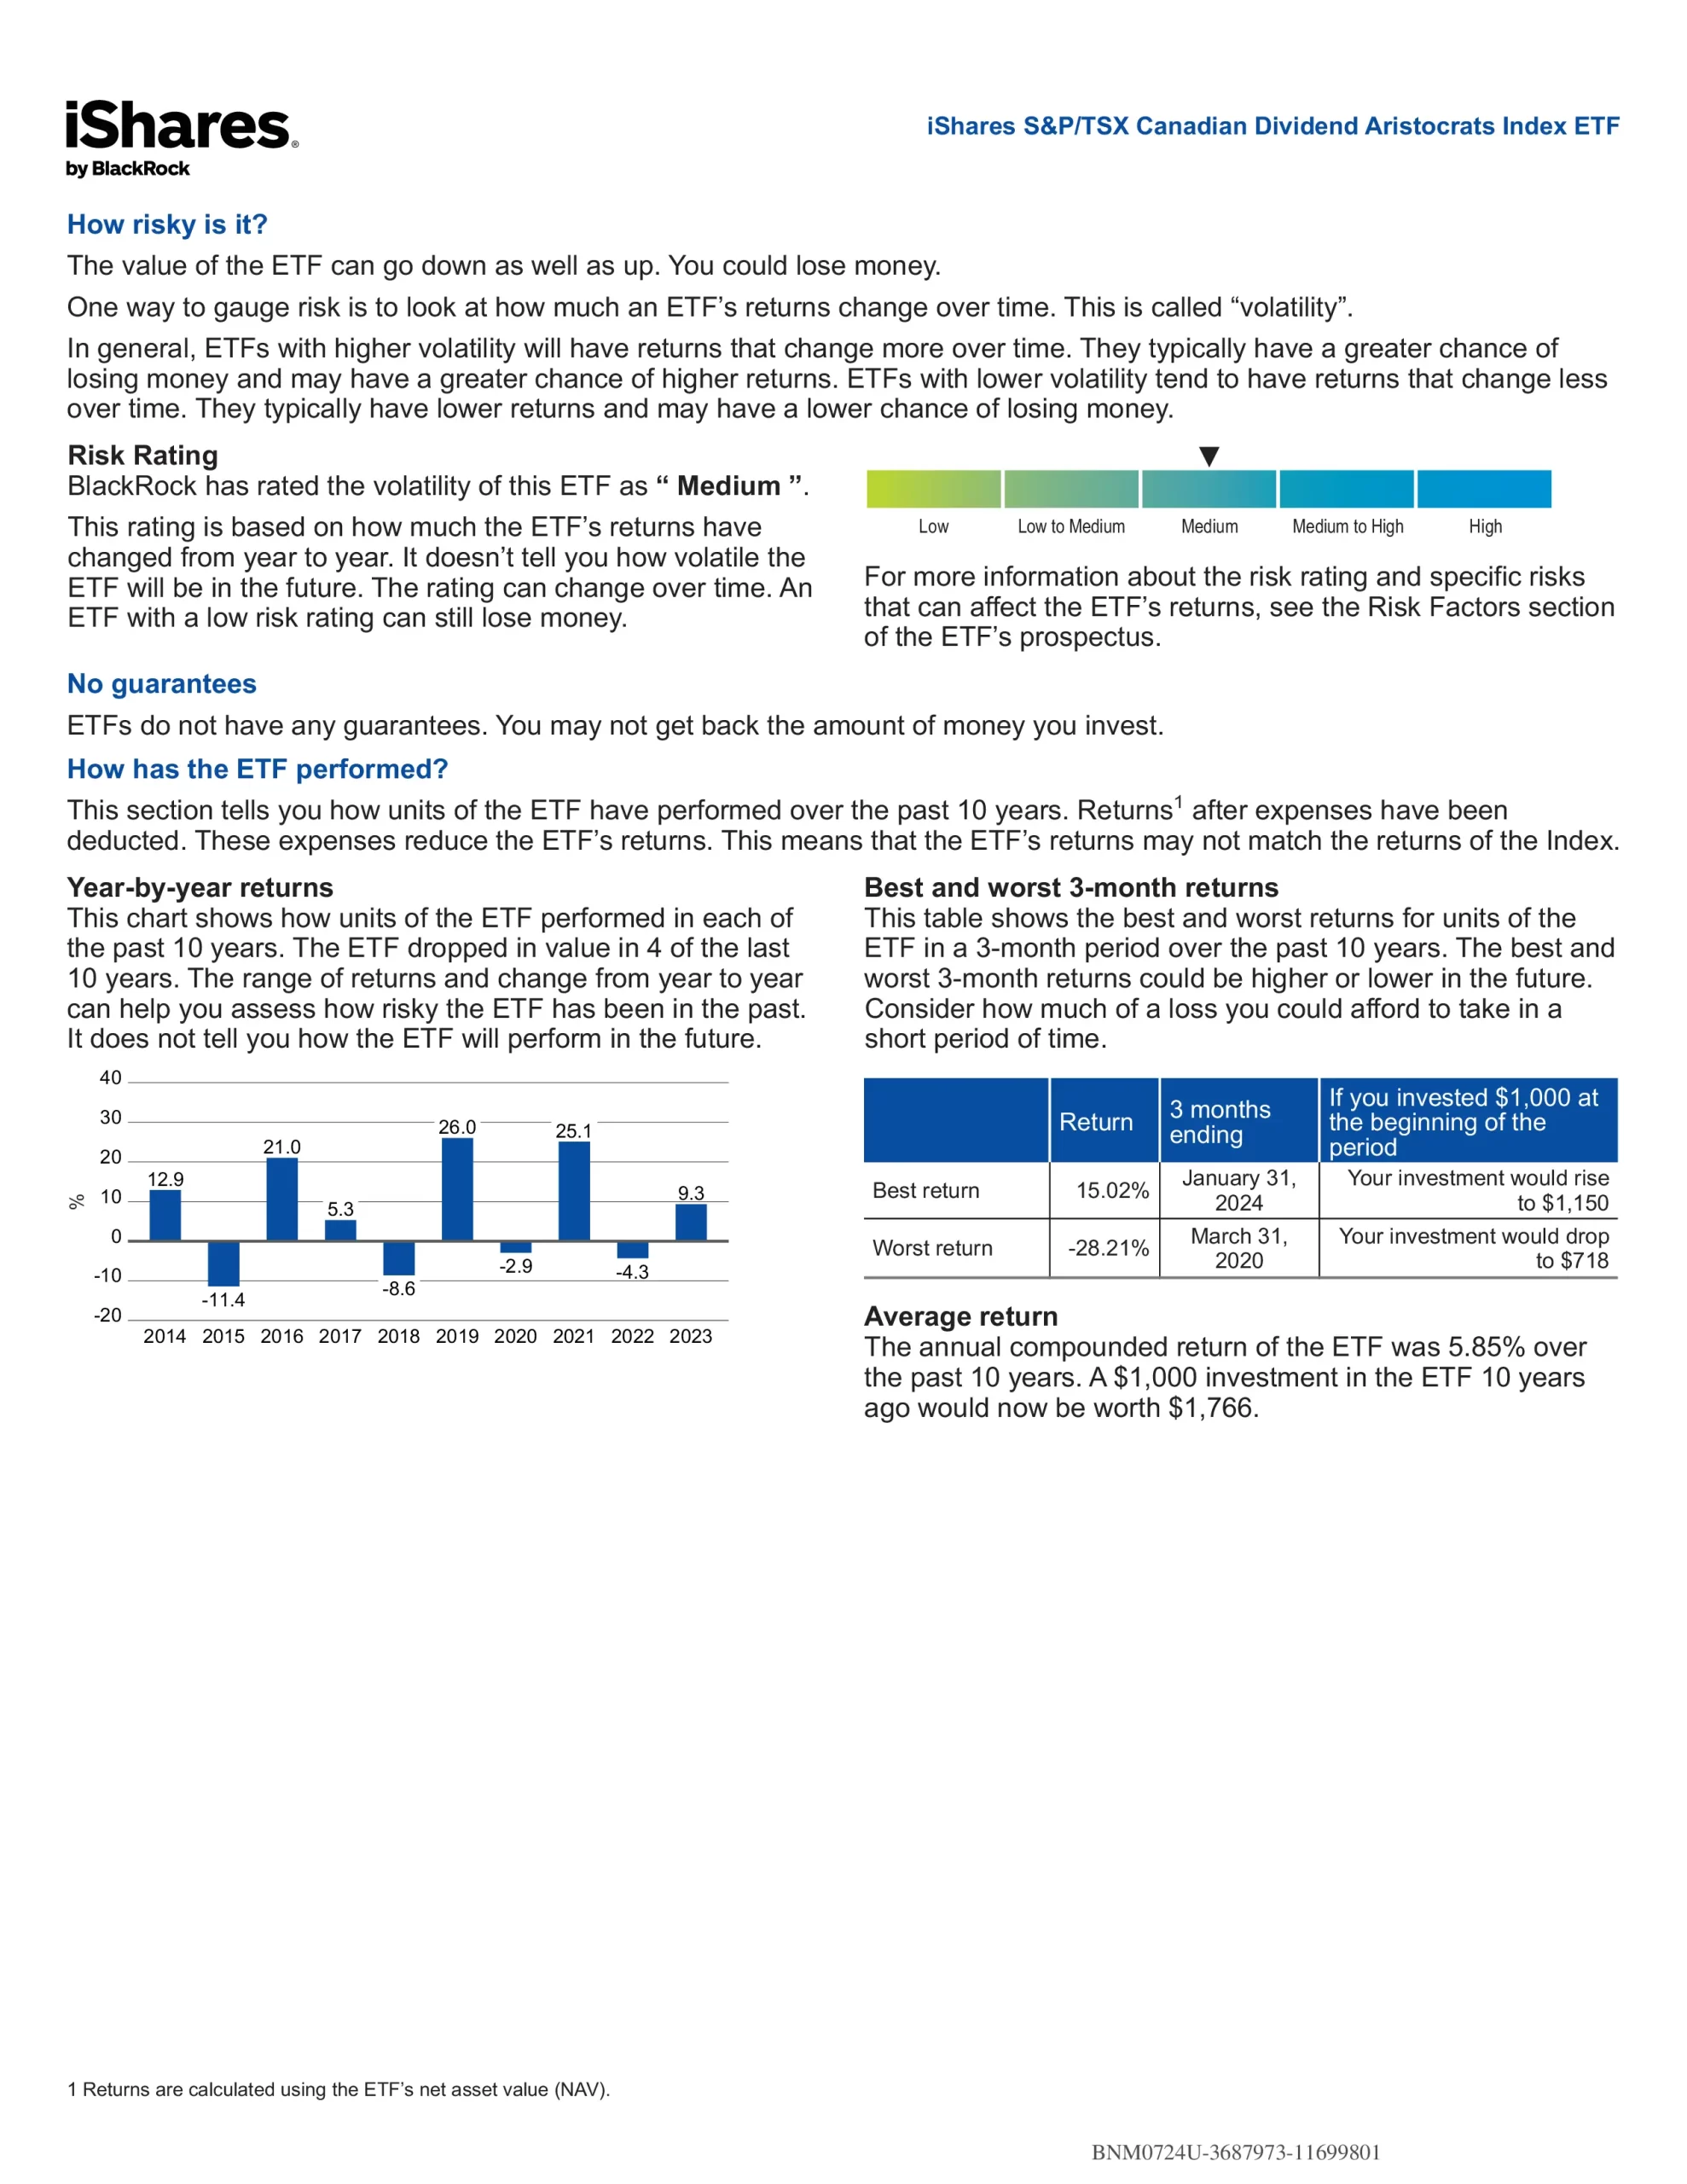
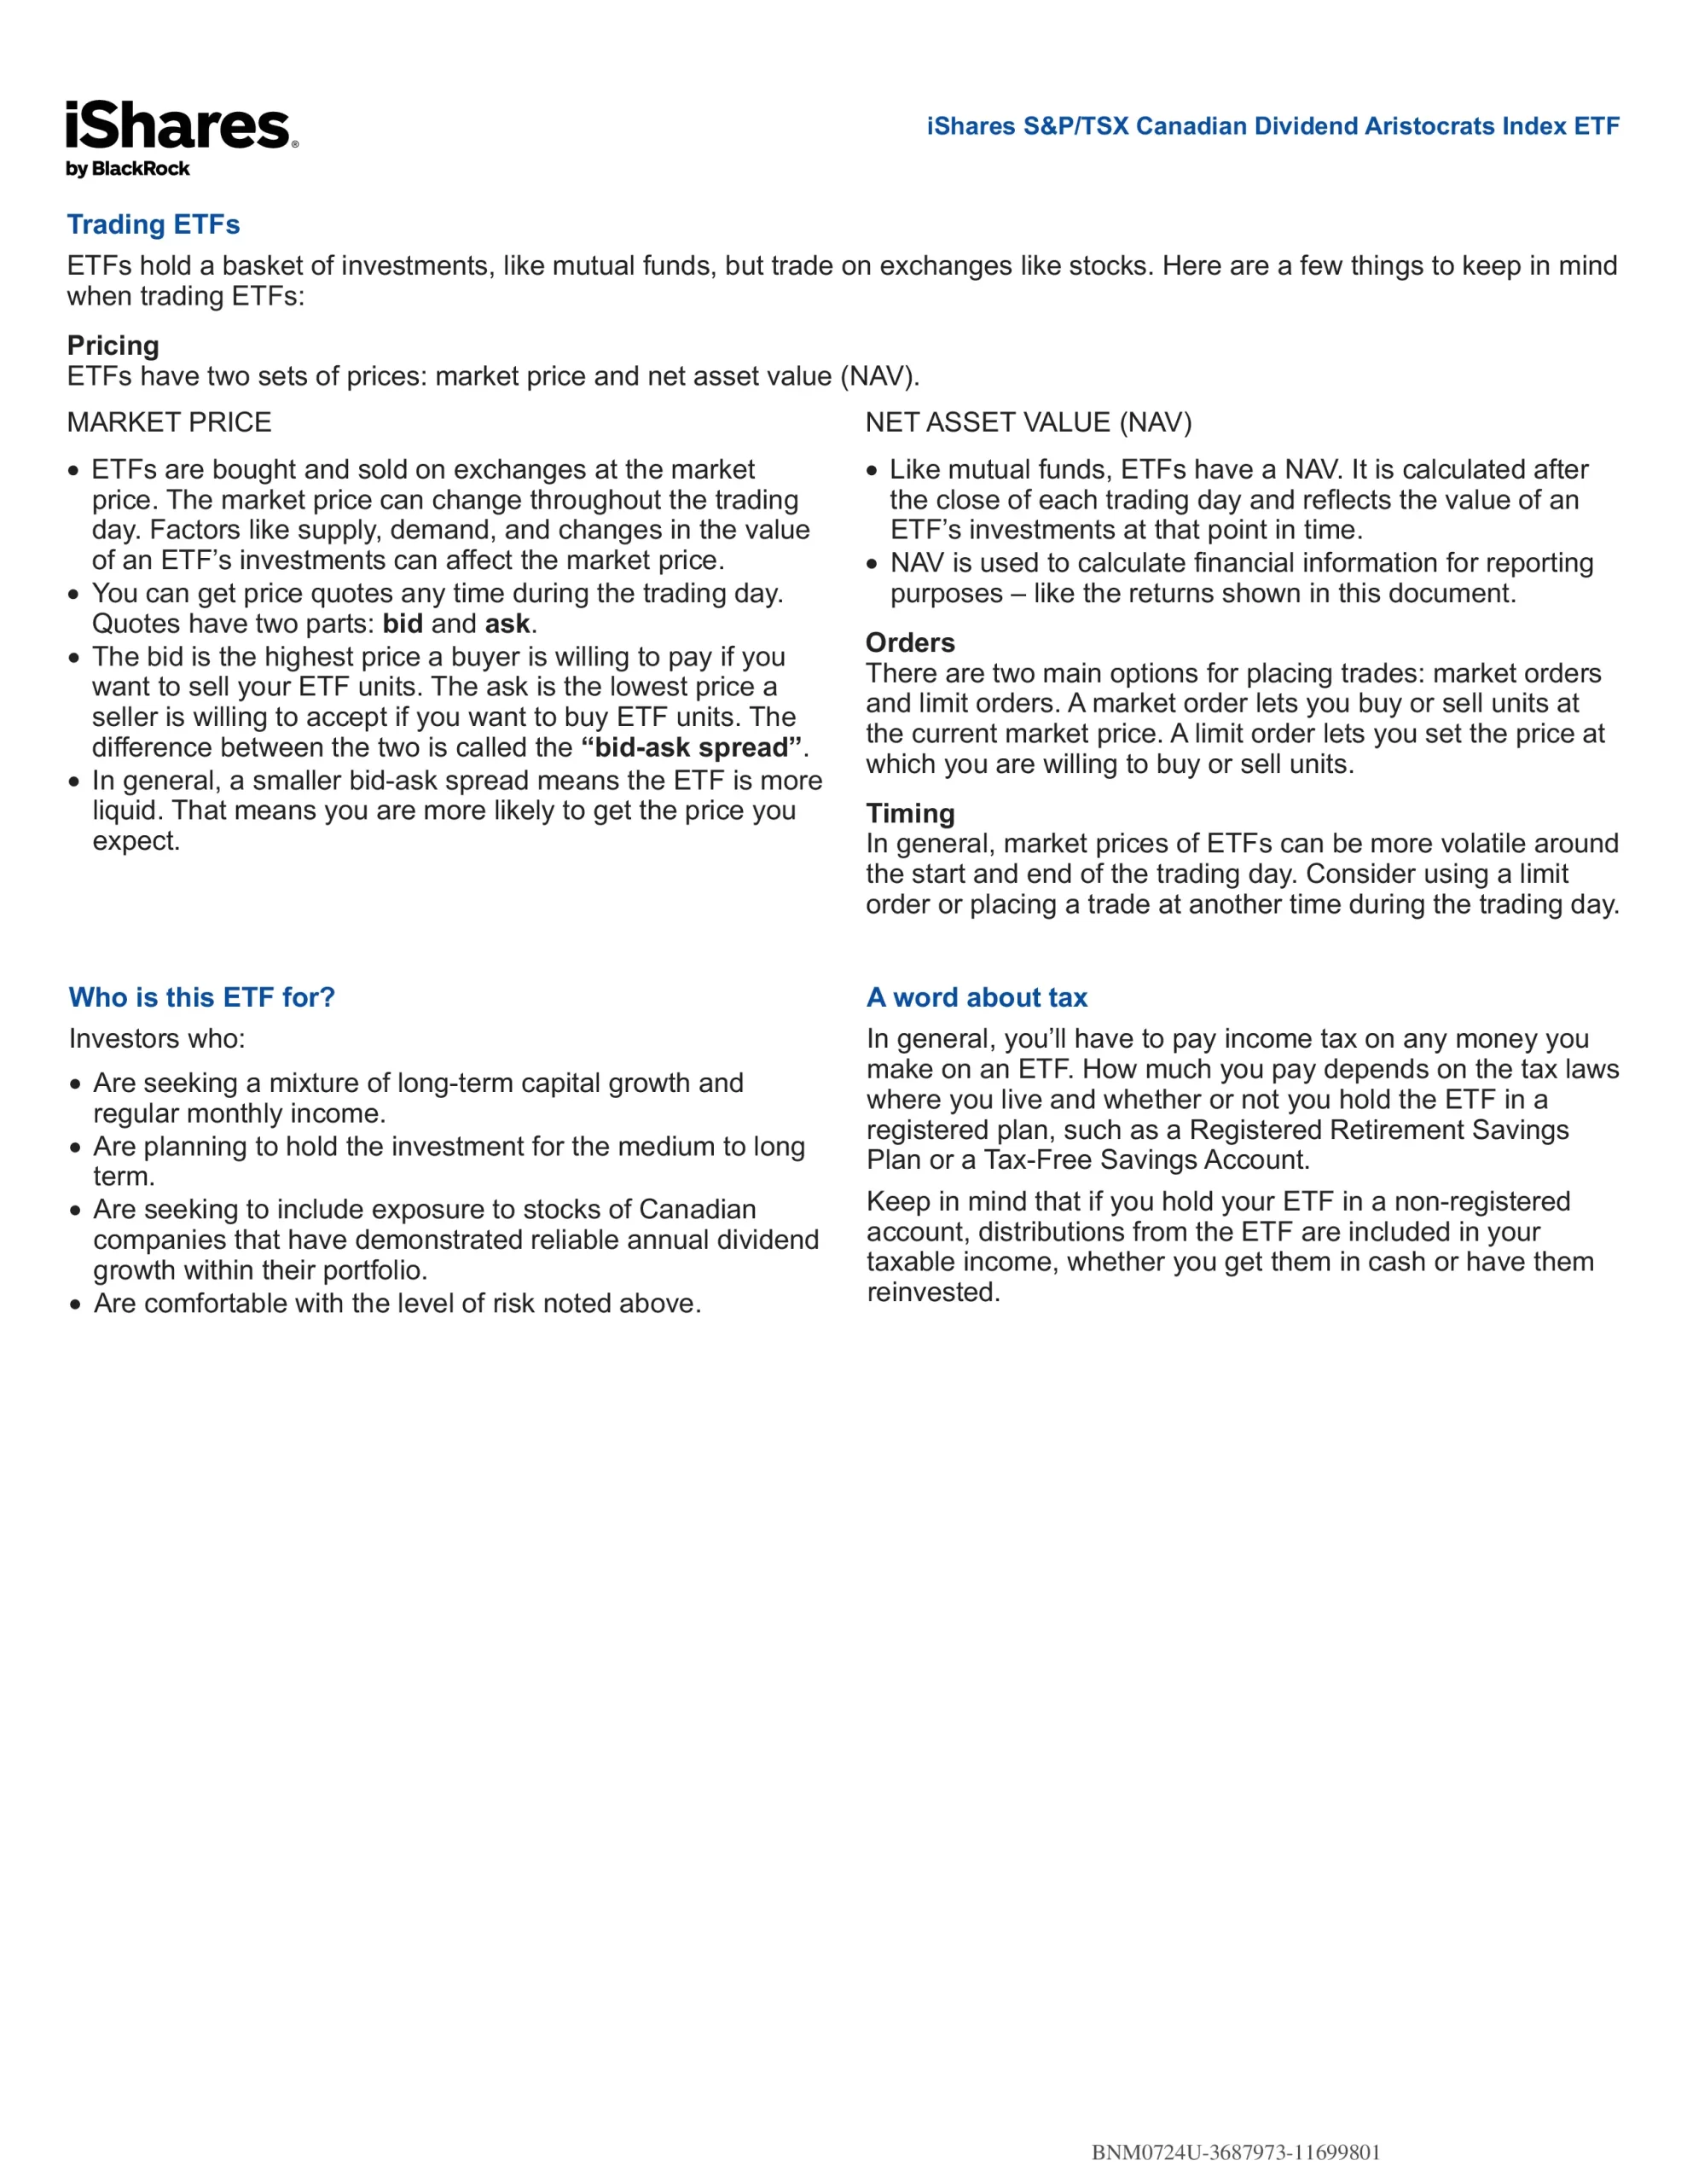
10. iShares S&P/TSX Canadian Dividend Aristocrats Index ETF
iShares S&P/TSX Canadian Dividend Aristocrats Index ETF (CDZ) has been designed to replicate, to the extent possible, the performance of the S&P/TSX Canadian Dividend Aristocrats Index. Under normal market conditions, the ETF will primarily invest in securities of one or more exchange-traded funds managed by BlackRock or an affiliate and/or Canadian equity securities. The Index consists of equity securities issued by Canadian issuers who have increased dividends in at least four of the past five years. Securities must also meet minimum criteria for market capitalization and liquidity to be included in the Index.
- Underlying index screens for large, established Canadian companies that increased ordinary cash dividends every year for at least five consecutive years
- Diversified exposure to a portfolio of high-quality Canadian dividend-paying companies
- Earn regular monthly dividend income
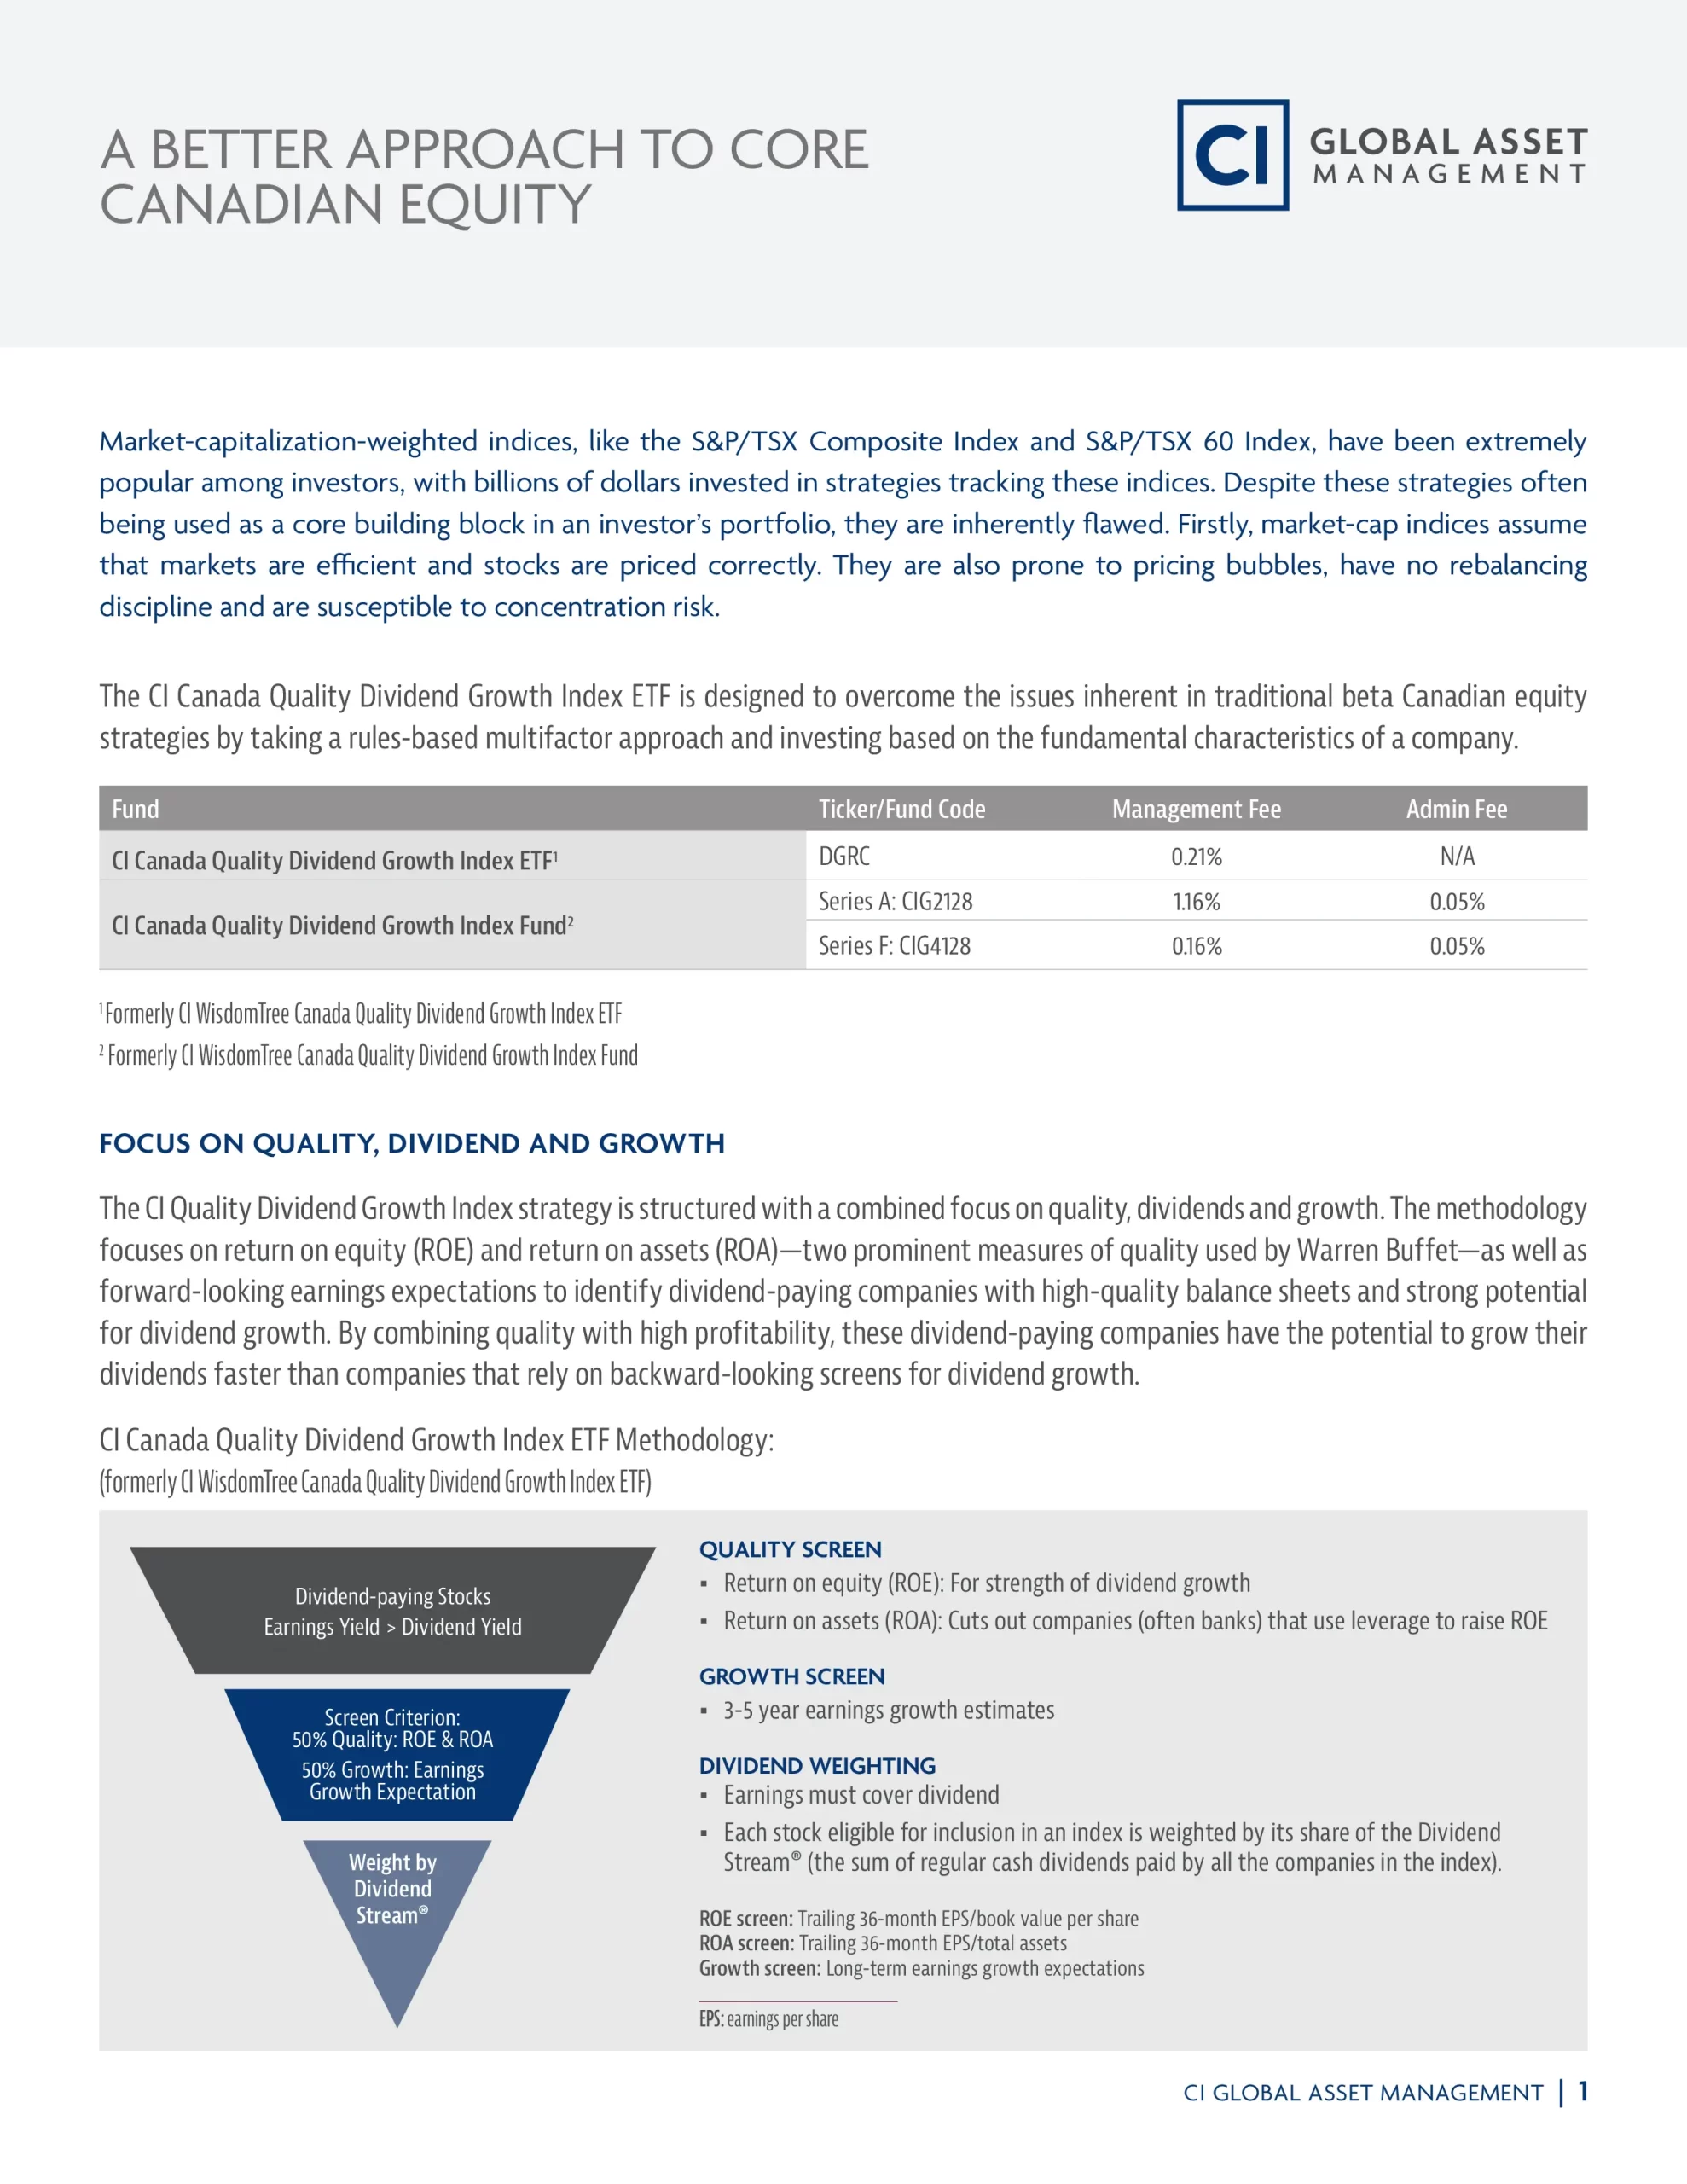
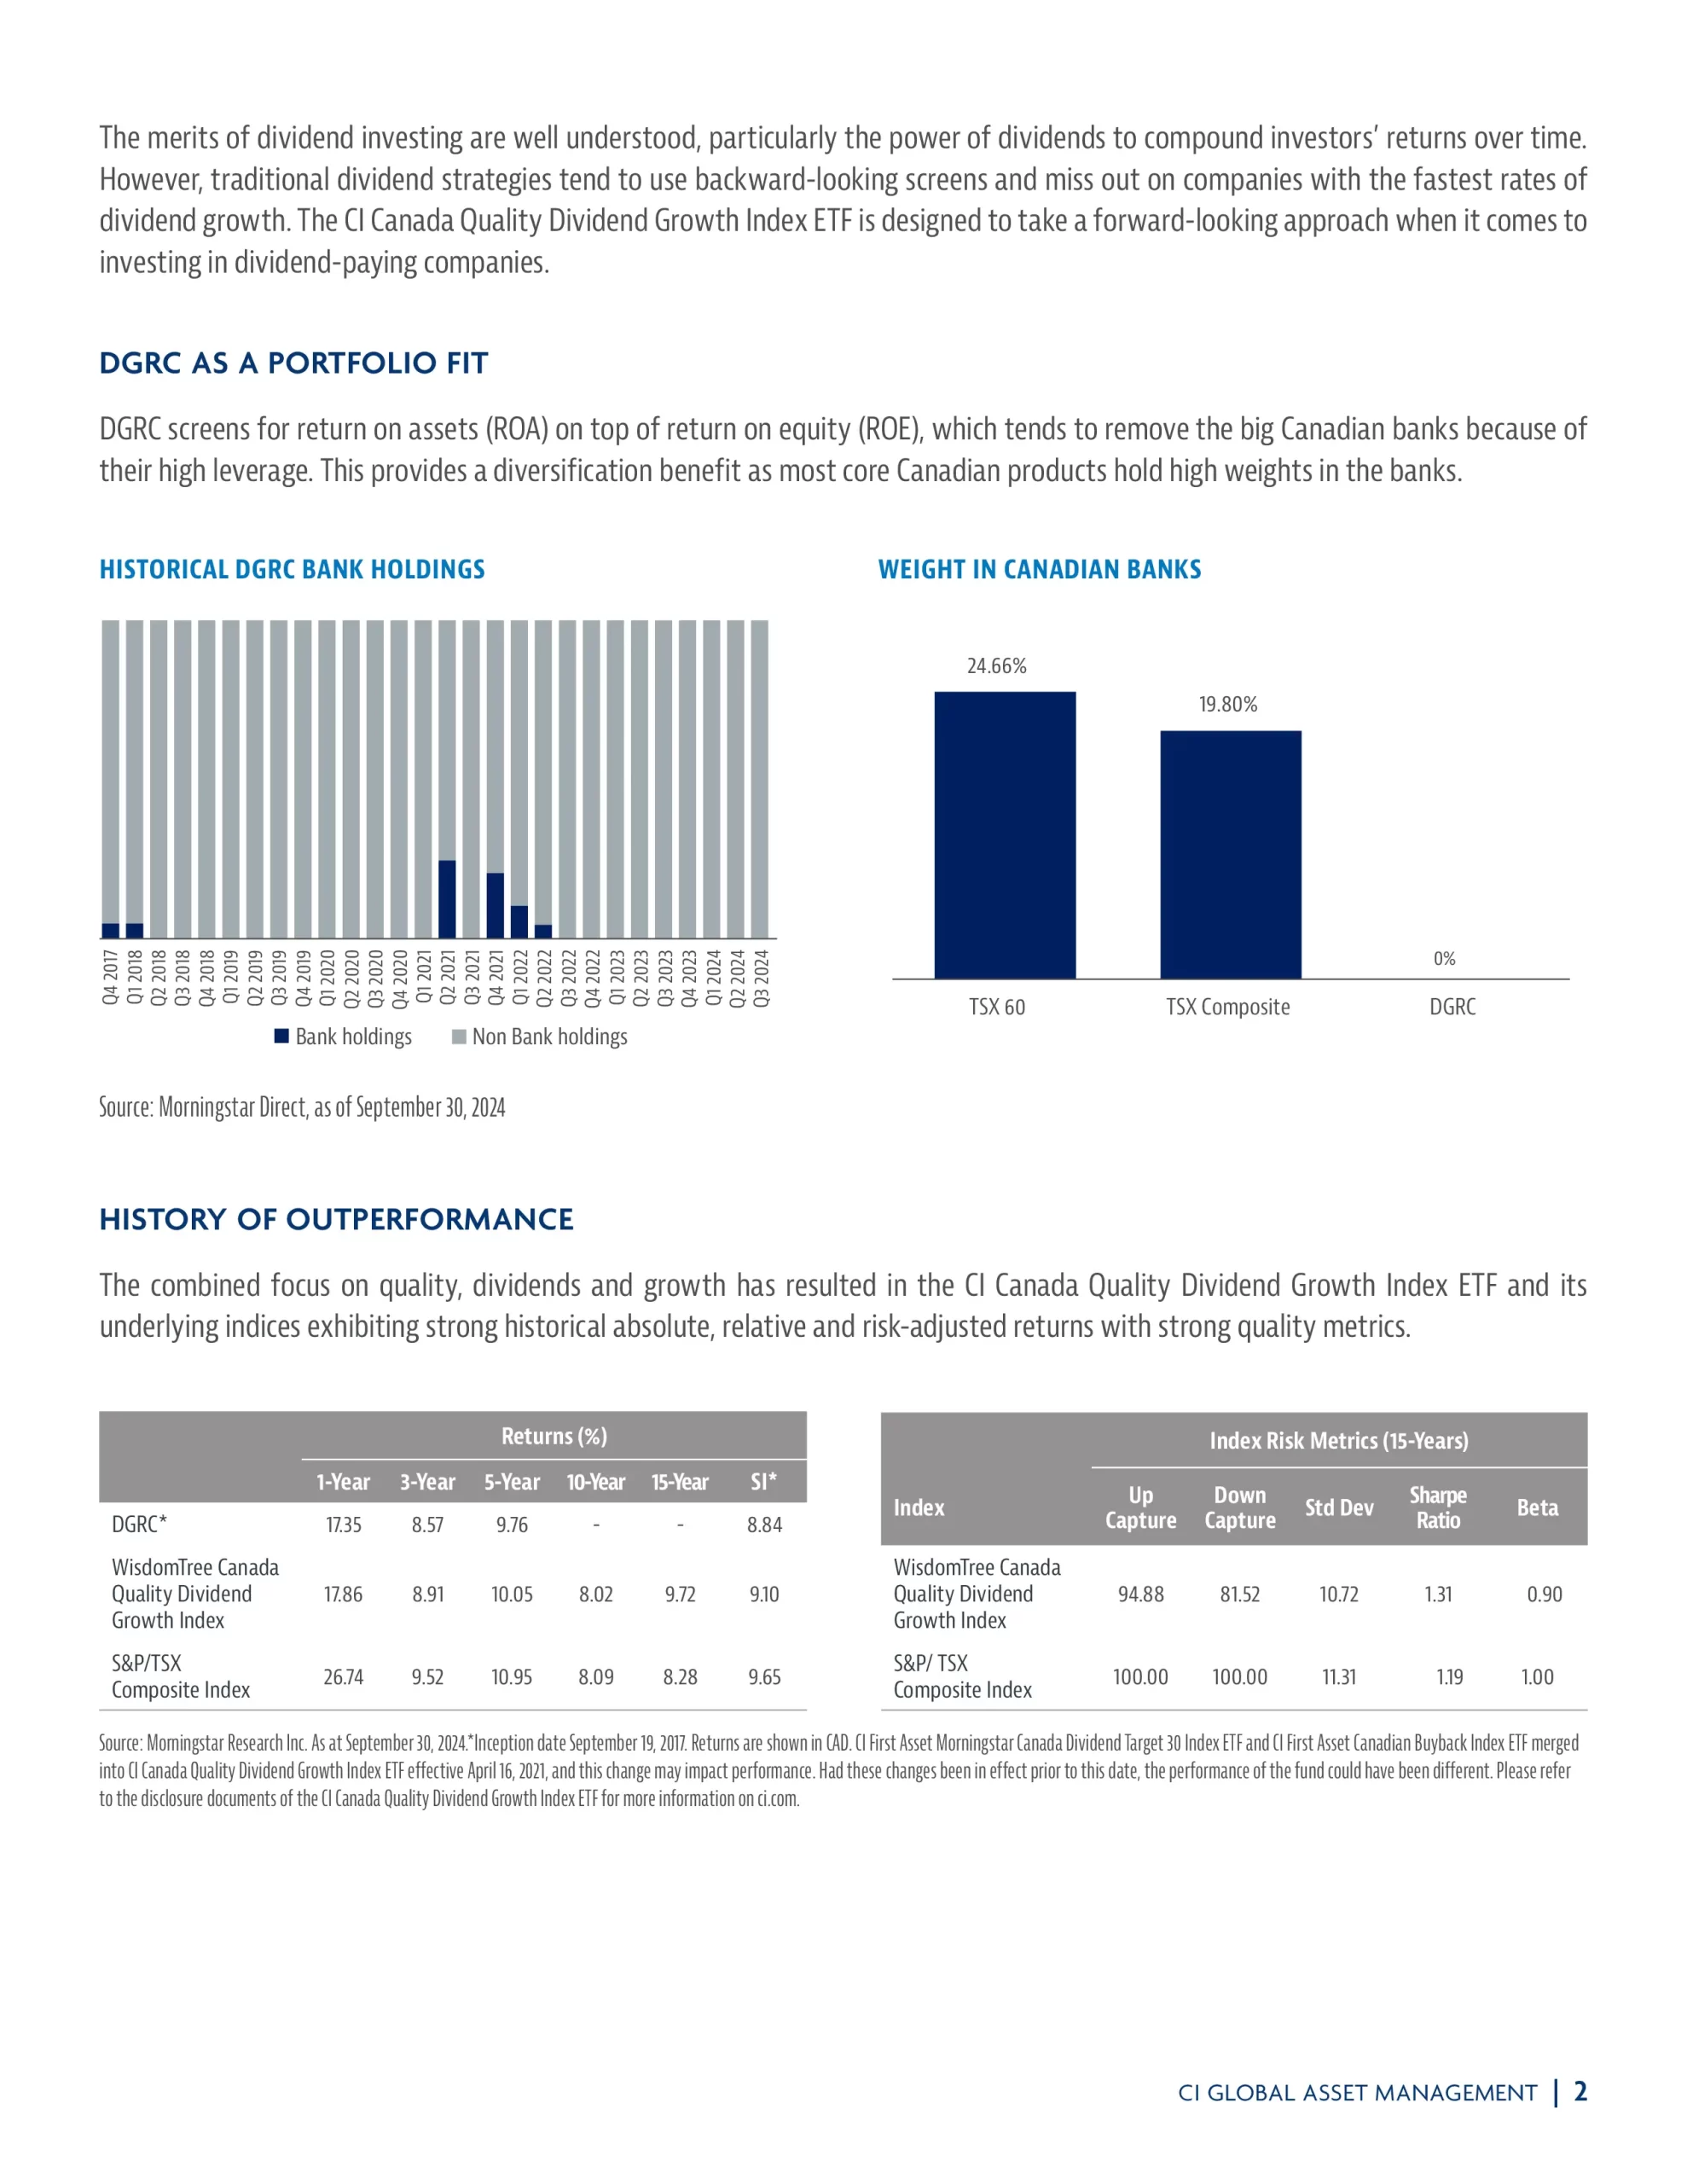
9. CI WisdomTree Canada Quality Dividend Growth Index ETF
CI WisdomTree Canada Quality Dividend Growth Index ETF (DGRC) seeks to track, to the extent possible, the price and yield performance of the WisdomTree Canada Quality Dividend Growth Index.
- Want to invest in a broad range of equity securities of Canadian companies
- Can handle the ups and downs of the stock market
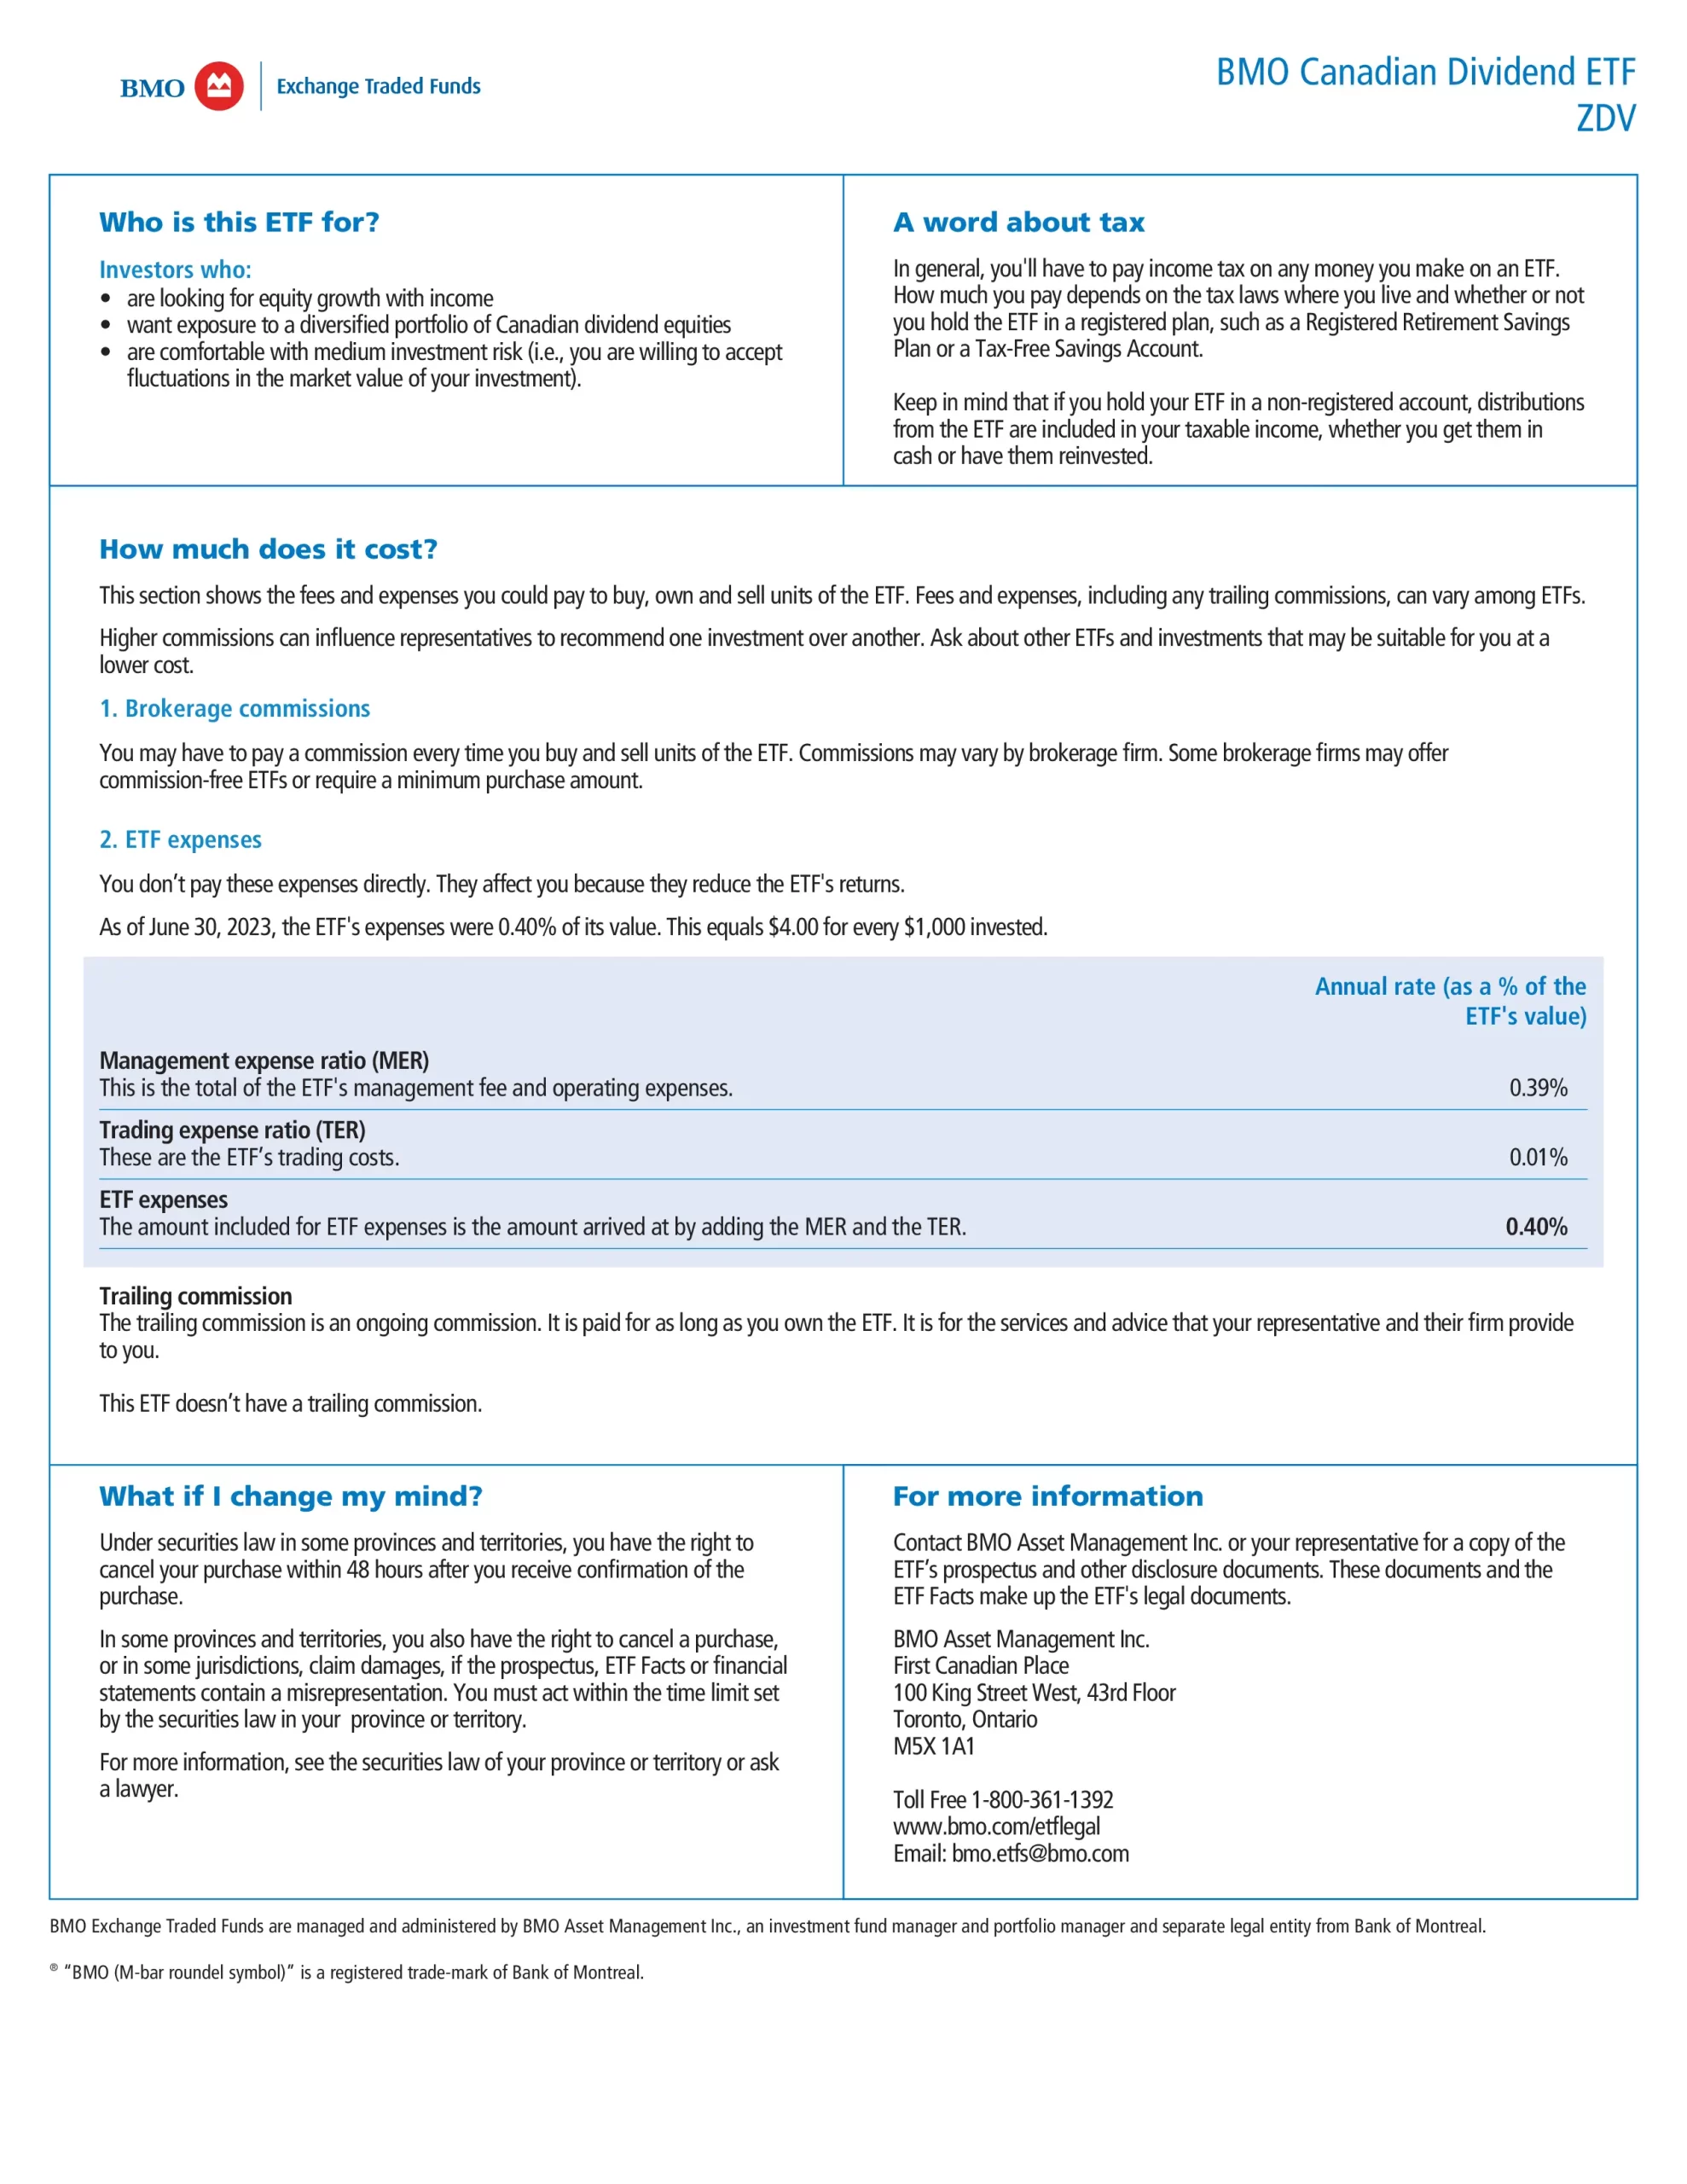
8. BMO Canadian Dividend ETF
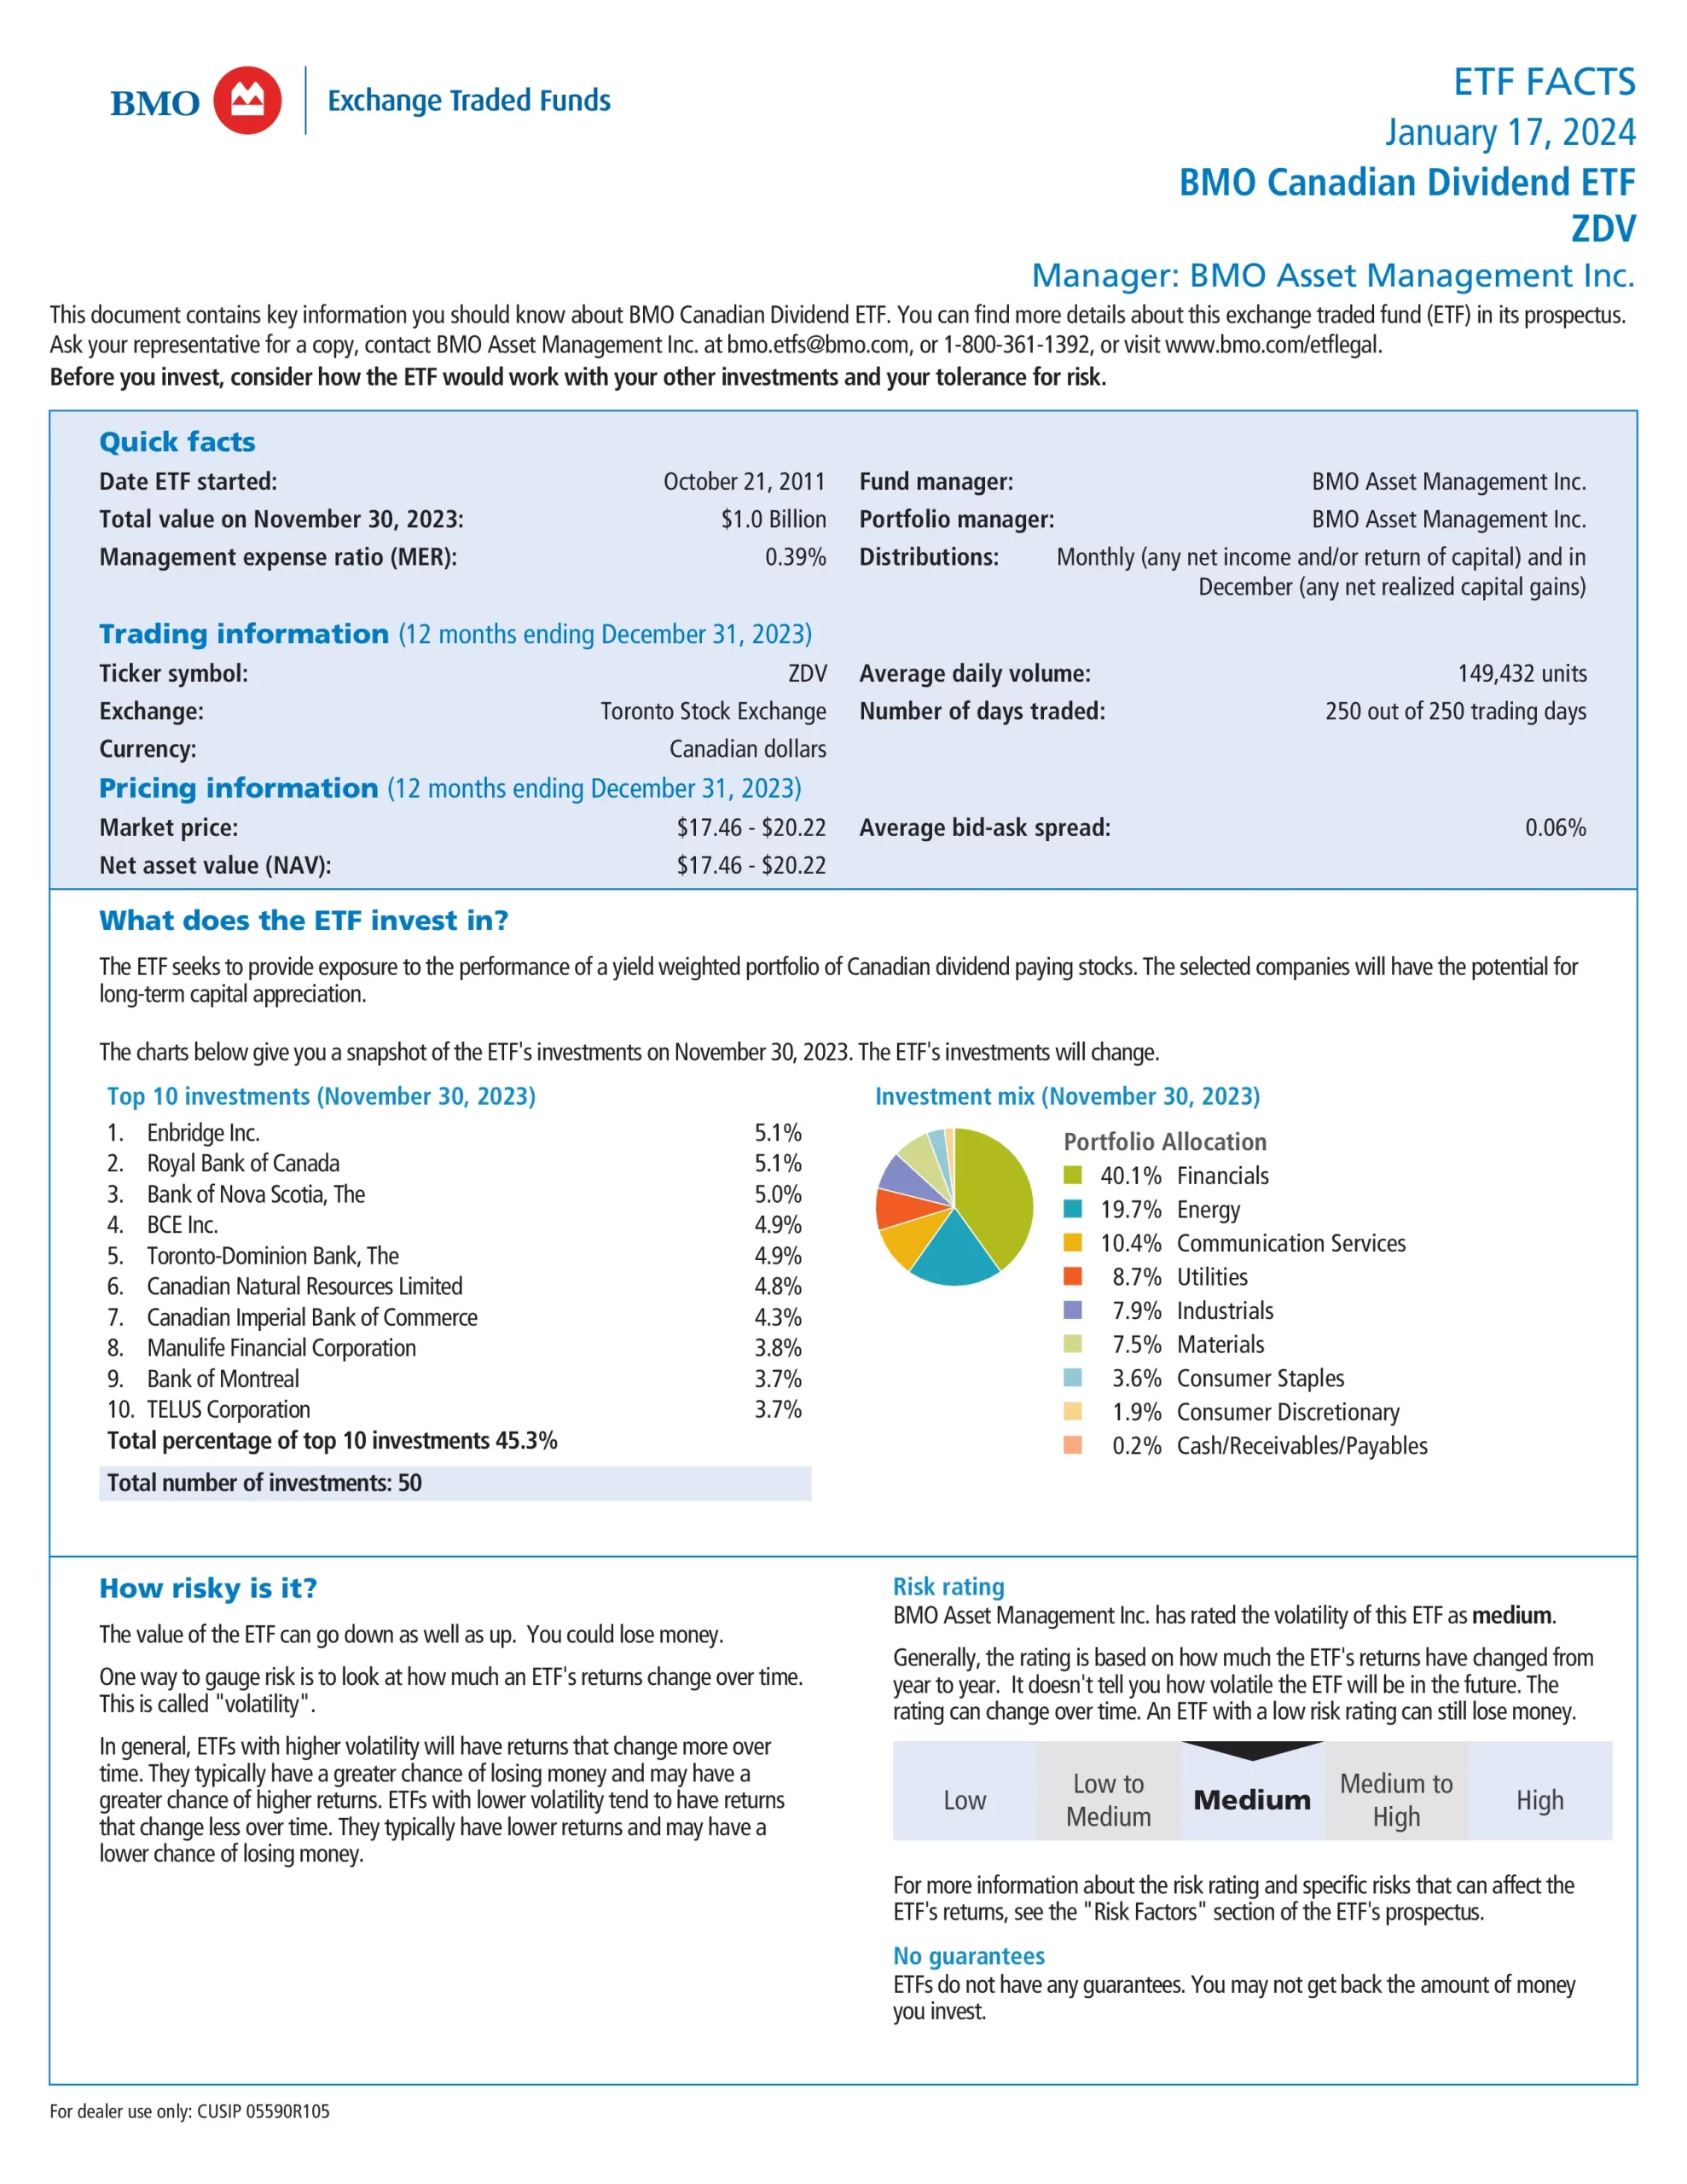
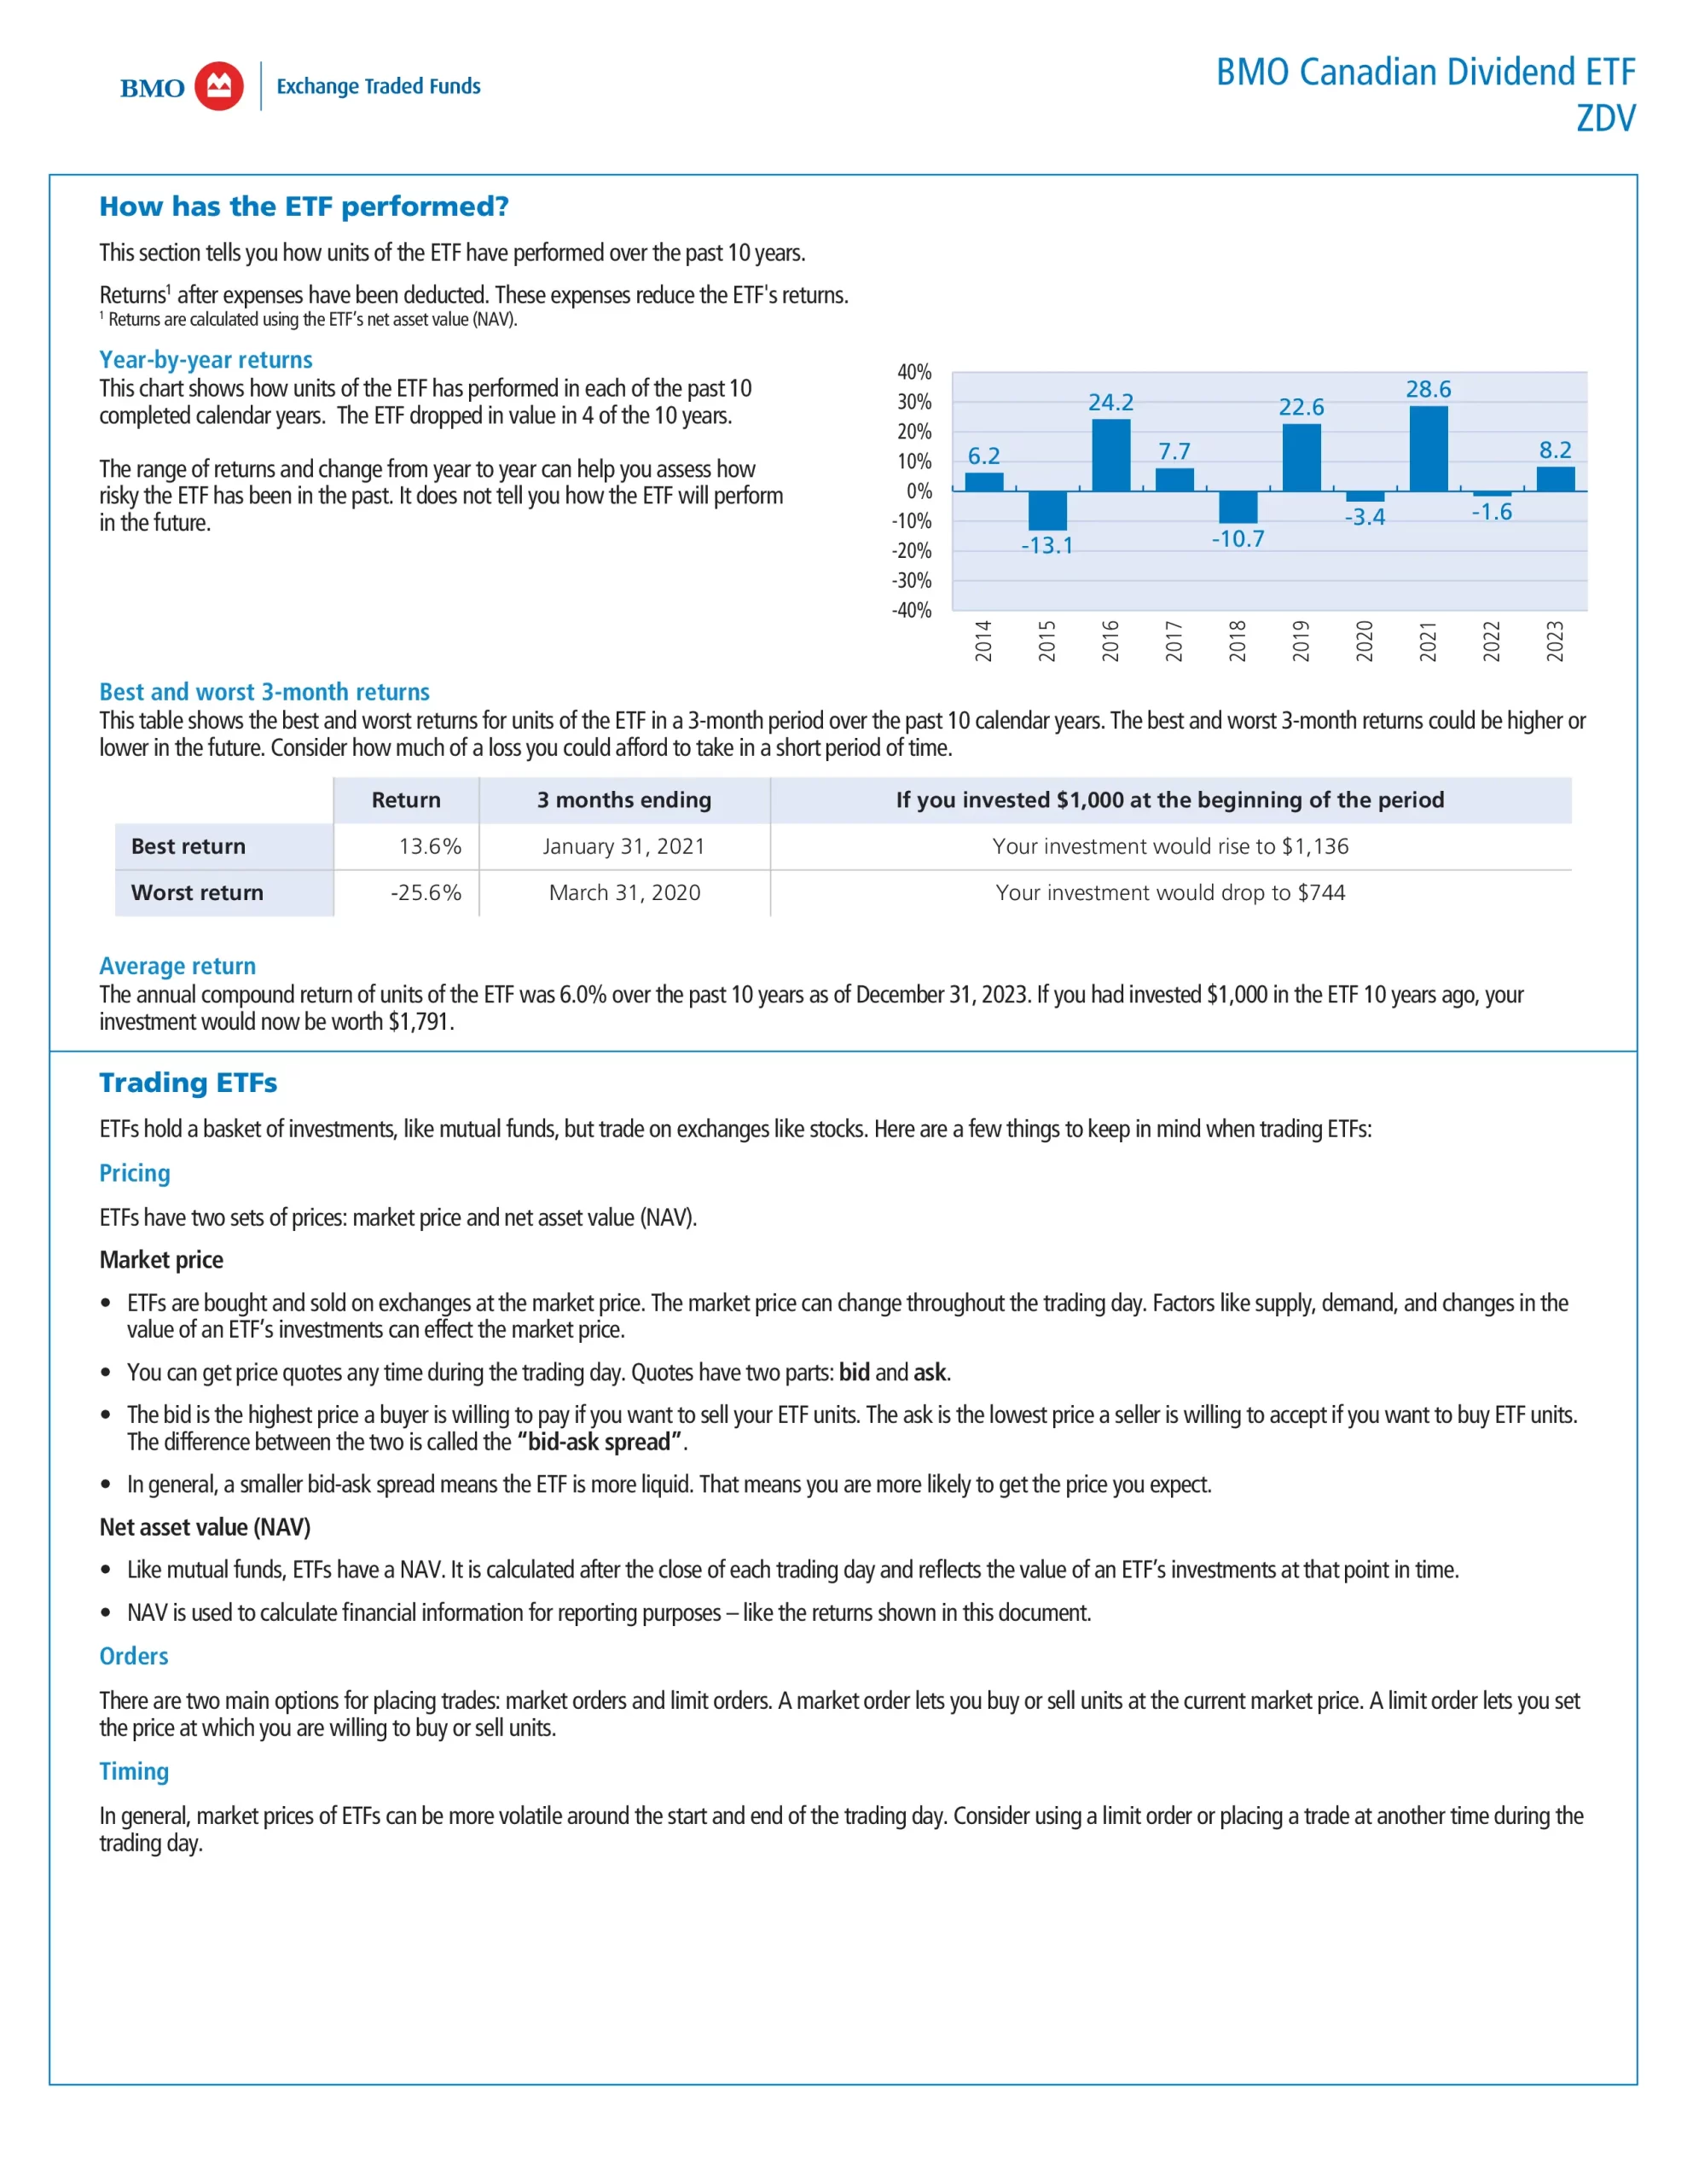
BMO Canadian Dividend ETF (ZDV) has been designed to provide exposure to a yield-weighted portfolio of Canadian dividend-paying stocks. ZDV uses a rules-based methodology considering the three-year dividend growth rate, yield, and payout ratio to invest in Canadian equities. Securities will also be subject to a liquidity screening process. The underlying portfolio is rebalanced in May and reconstituted in November.
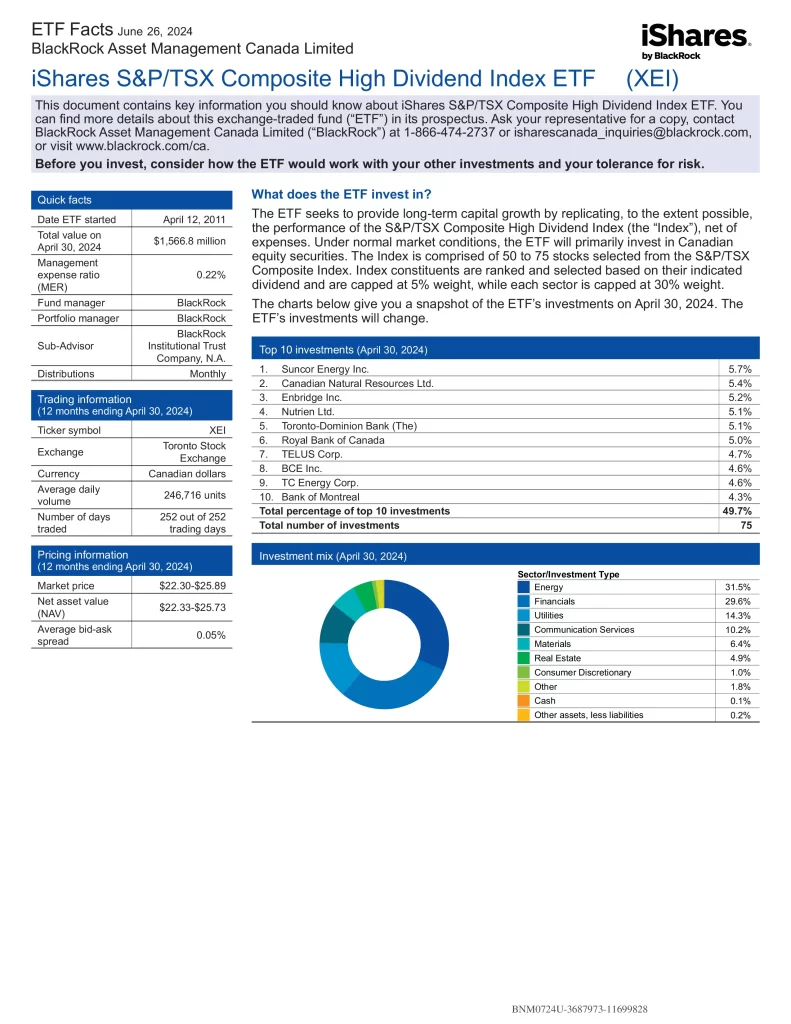
7. iShares S&P/TSX Composite High Dividend Index ETF
iShares S&P/TSX Composite High Dividend Index ETF (XEI) seeks long-term capital growth by replicating the performance of the S&P/TSX Composite High Dividend Index.
- Designed to be a long-term foundational holding
- Pays monthly dividend income
- Low cost


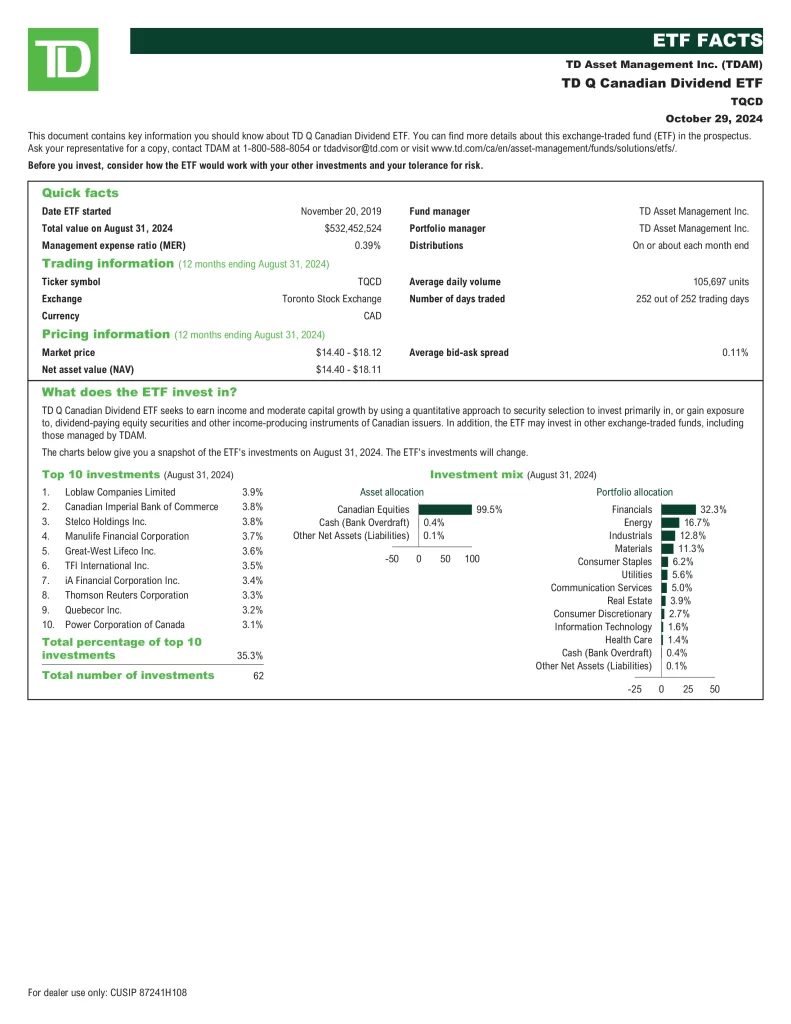
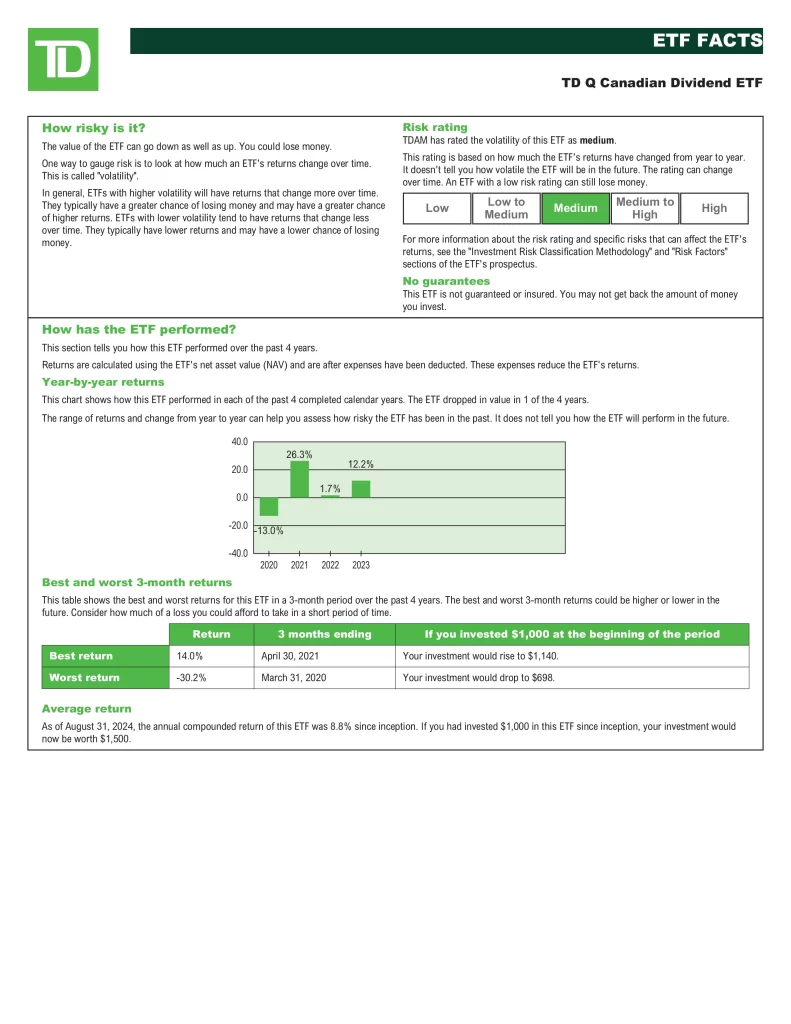
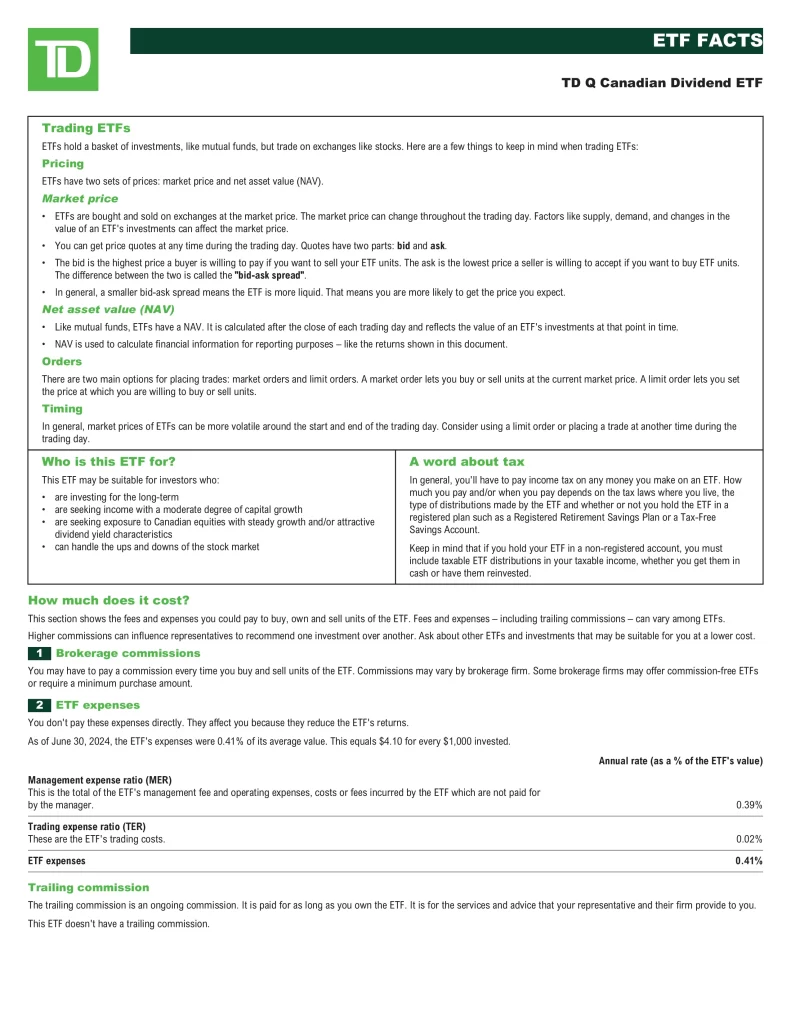
6. TD Q Canadian Dividend ETF
TD Q Canadian Dividend ETF (TQCD) seeks to earn income and moderate capital growth by using a quantitative approach to security selection to invest primarily in, or gain exposure to, dividend-paying equity securities and other income-producing instruments of Canadian issuers. The portfolio adviser seeks to achieve the fundamental investment objective of TD Q Canadian Dividend ETF by investing primarily in a diversified portfolio of income-producing securities of Canadian issuers, which may include but is not limited to, dividend-paying common and preferred shares and real estate investment trusts (REITs). The TD ETF may also invest in other exchange-traded funds. The portfolio adviser utilizes a quantitative equity strategy to identify and optimize exposure to stocks that have above-average dividend yields and/or issuers that are expected to pay out increasing dividends over time.
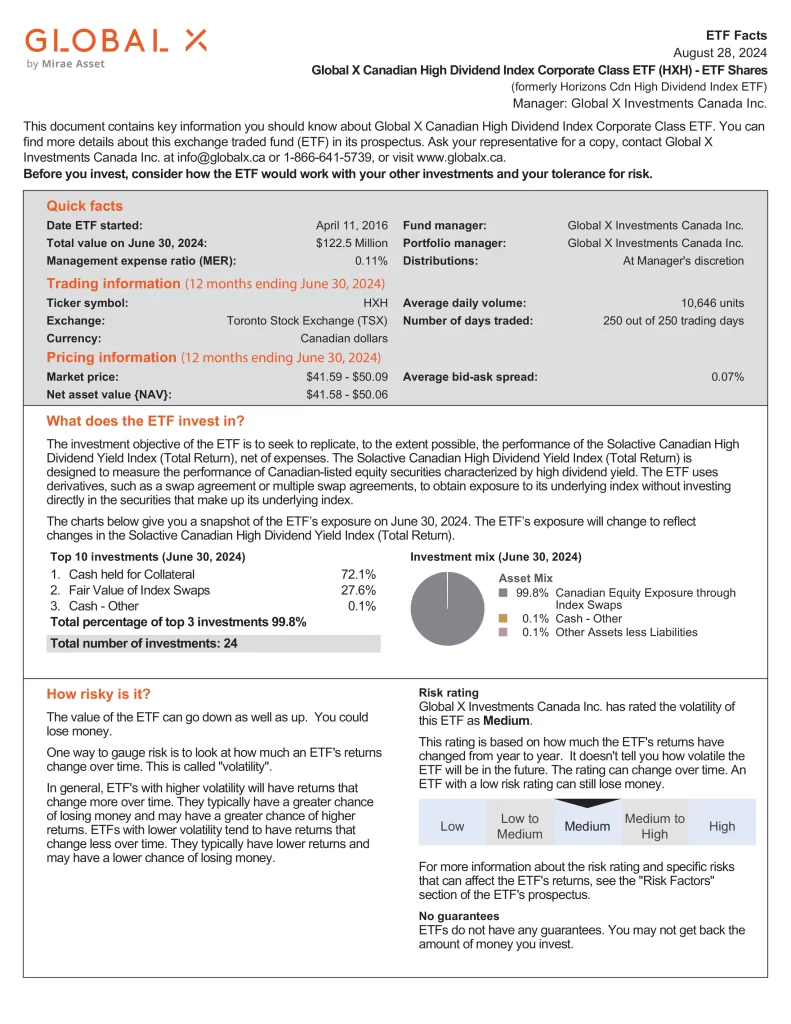
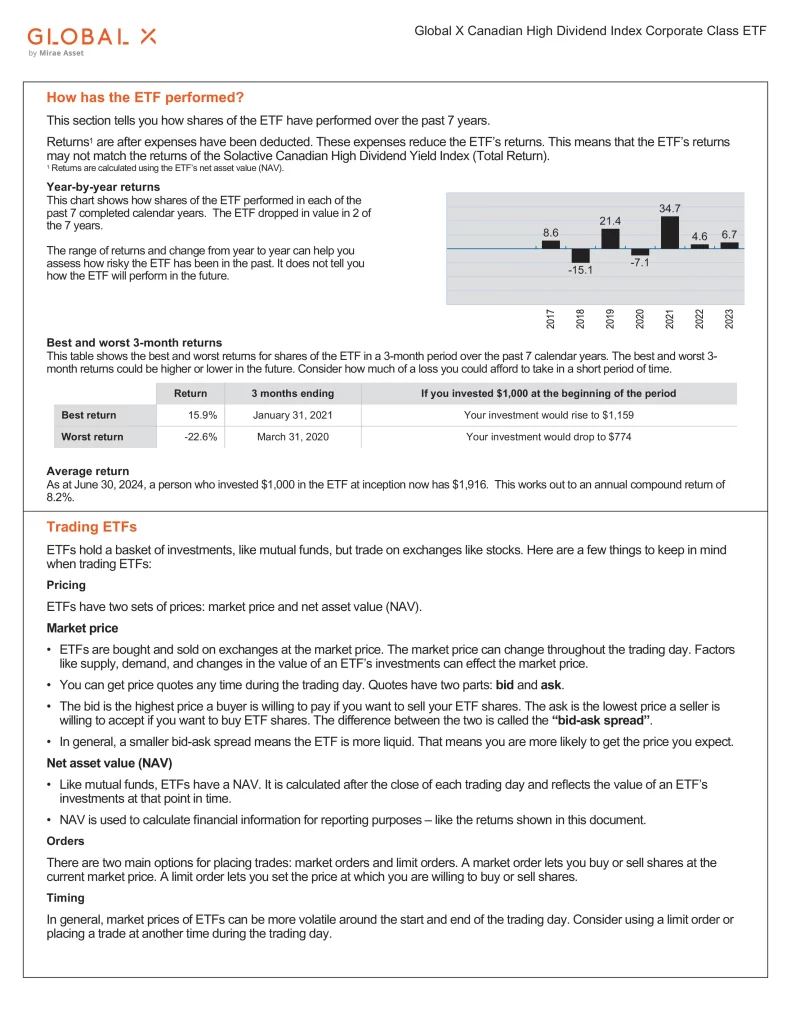
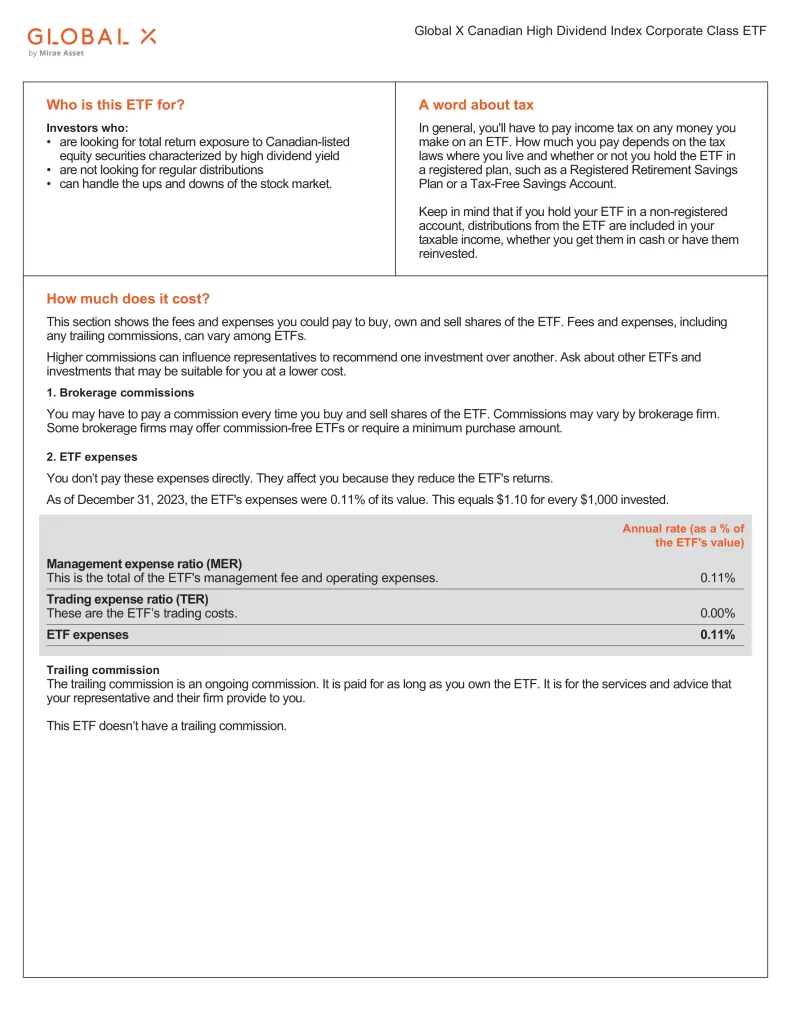
5. Global X Canadian High Dividend Index Corporate Class ETF
Global X Canadian High Dividend Index Corporate Class ETF (HXH) seeks to replicate the performance of the Solactive Canadian High Dividend Yield Index (Total Return). The Solactive Canadian High Dividend Yield Index (Total Return) is designed to measure the performance of Canadian-listed equity securities characterized by high dividend yield.
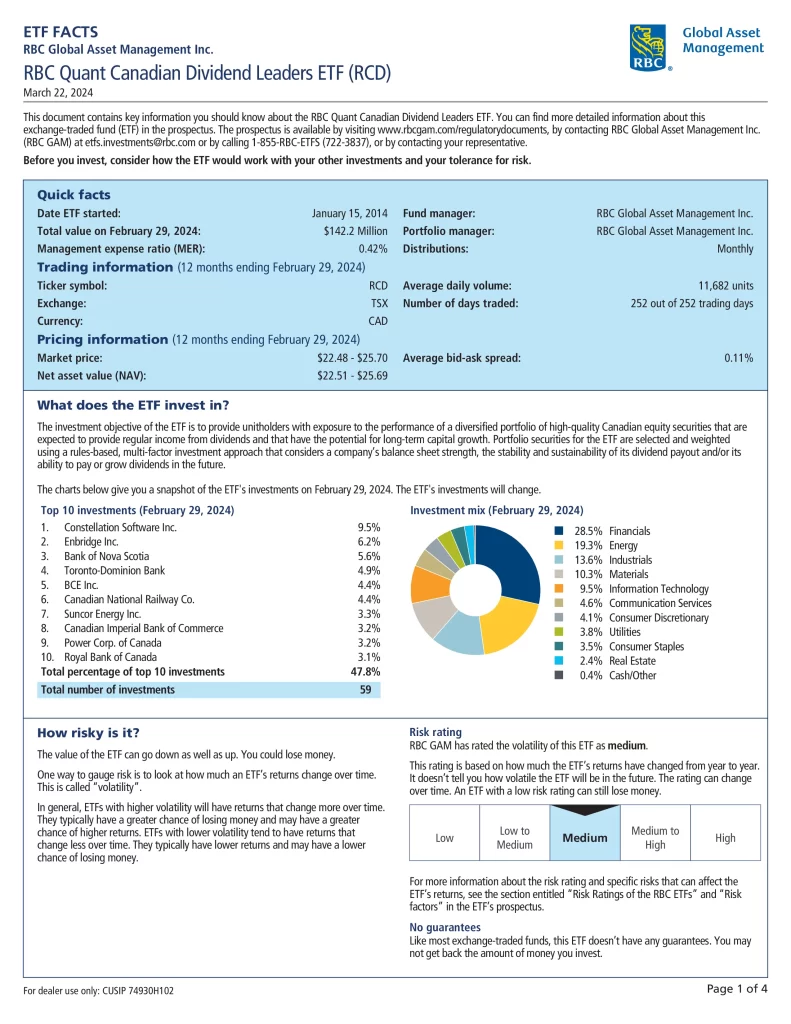
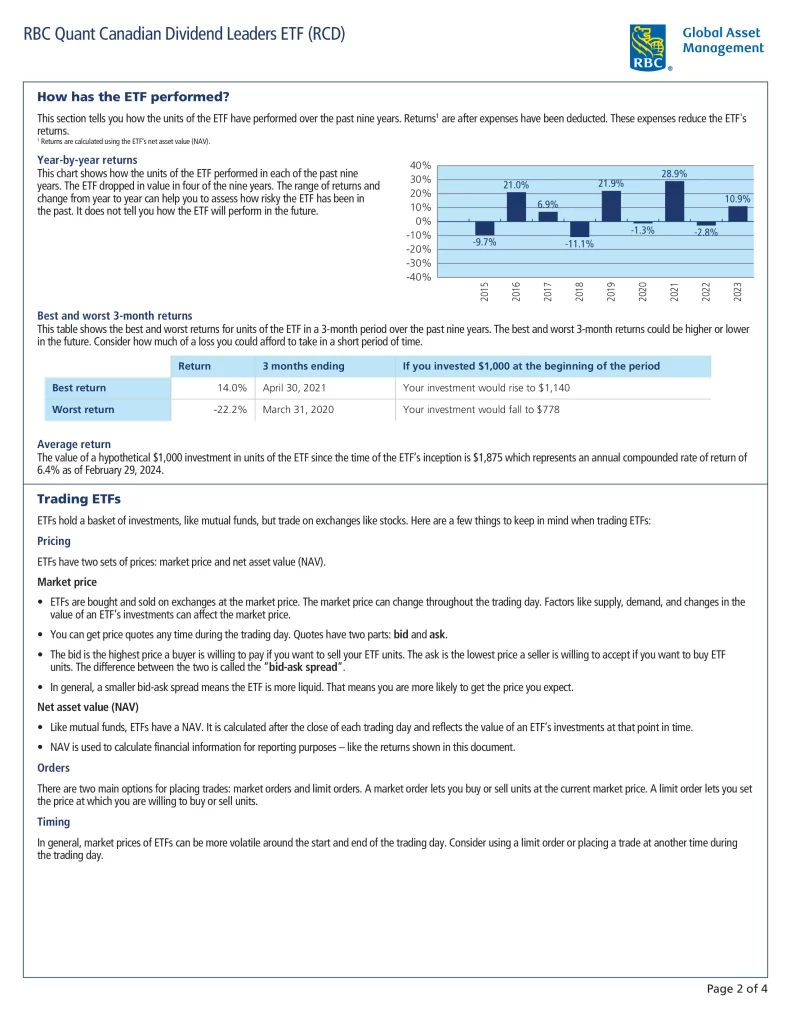
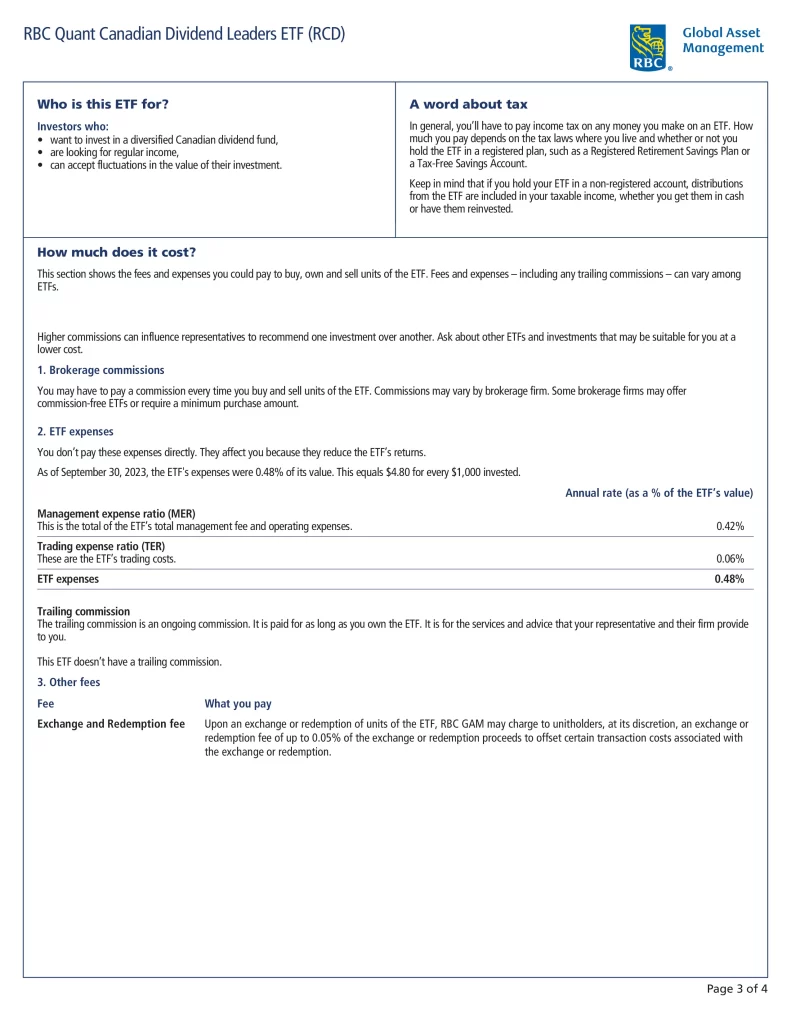
4. RBC Quant Canadian Dividend Leaders ETF
RBC Quant Canadian Dividend Leaders ETF (RCD) seeks to provide unitholders with exposure to the performance of a diversified portfolio of high-quality Canadian equity securities that are expected to provide regular income from dividends and that have the potential for long-term capital growth.
- A quantitative multi-factor approach is used to gauge a company’s financial strength
- Attractive dividend yield with long-term growth potential
- Emphasizes consistent and growing dividend payers
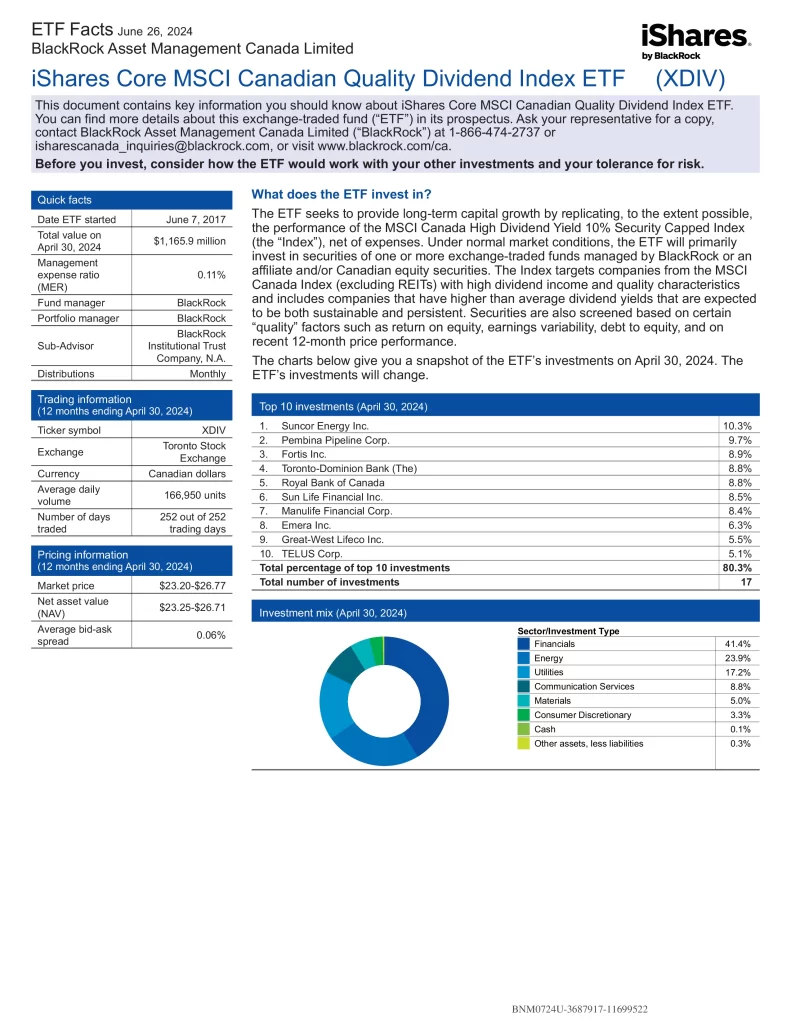
3. iShares Core MSCI Canadian Quality Dividend Index ETF
iShares Core MSCI Canadian Quality Dividend Index ETF (XDIV) seeks to provide long-term capital growth by replicating the performance of the MSCI Canada High Dividend Yield 10% Security Capped Index.
- Low-cost portfolio of Canadian stocks with above-average dividend yields and steady or increasing dividends
- Selects securities with strong overall financials, including solid balance sheets and less volatile earnings
- Designed to be a long-term core holding
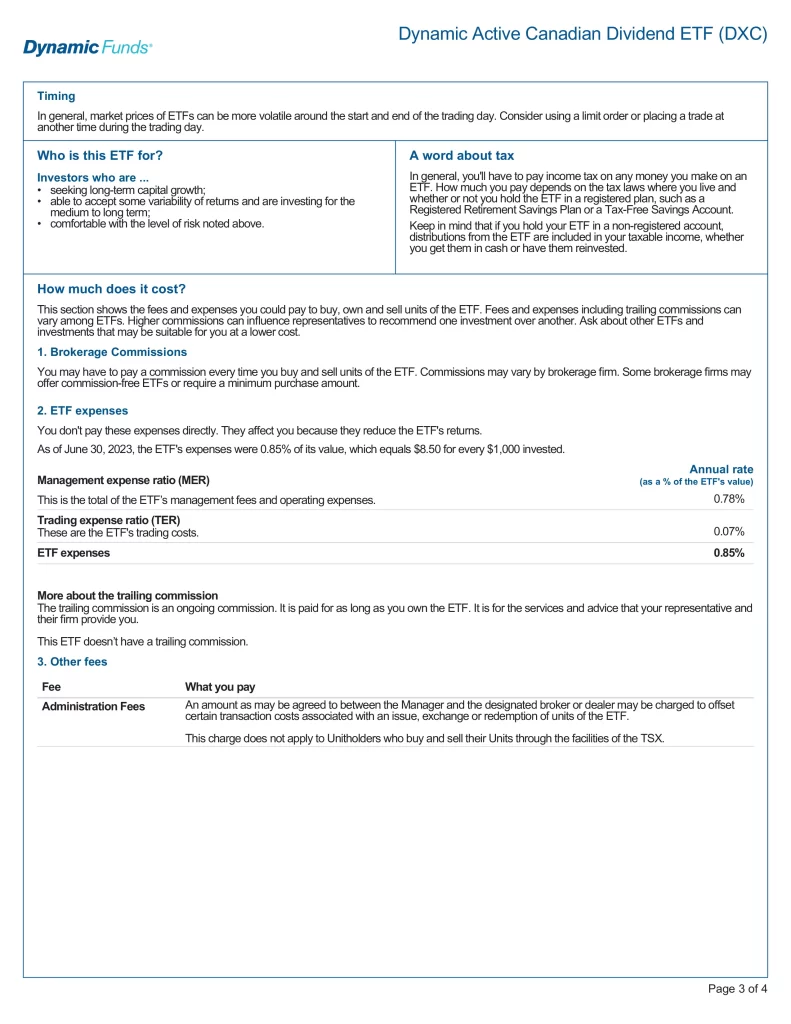
2. Dynamic Active Canadian Dividend ETF
Dynamic Active Canadian Dividend ETF (DXC) invests primarily in a broadly diversified portfolio of equity securities of Canadian-based businesses that pay or are expected to pay a dividend or distribution.
- Utilizes a bottom-up approach and fundamental analysis to assess growth and value potential
- Target companies that are attractively valued, have high margins and market share and are run by quality management teams
- Has the flexibility to access businesses located outside Canada
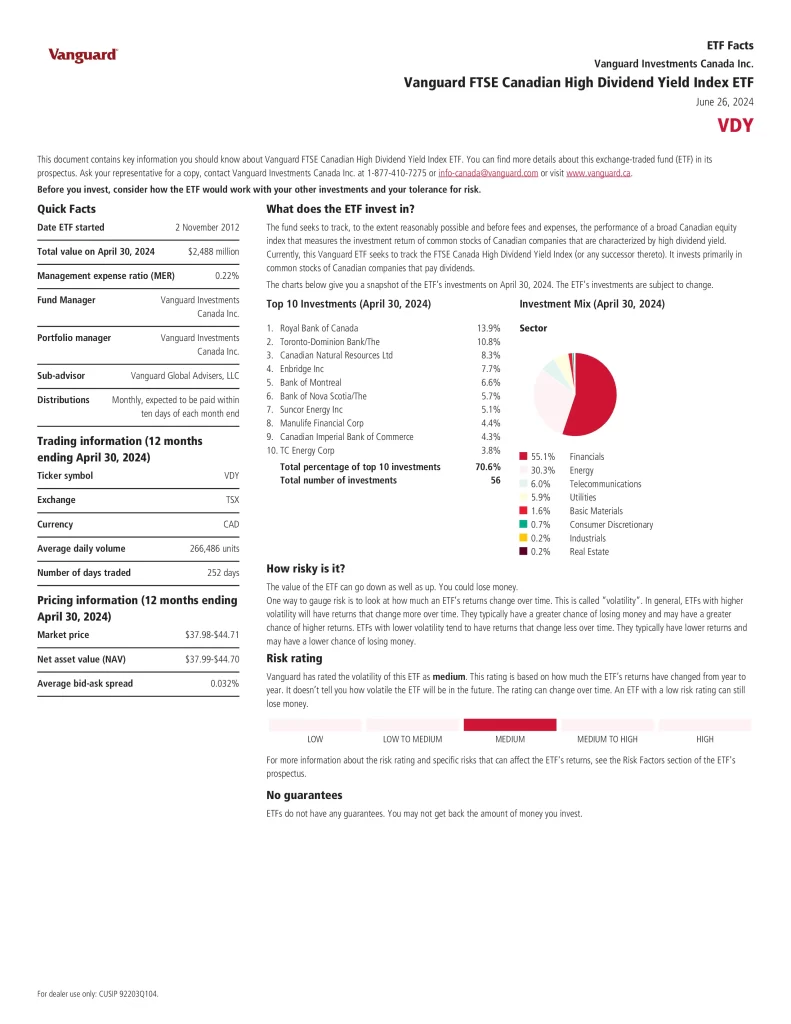
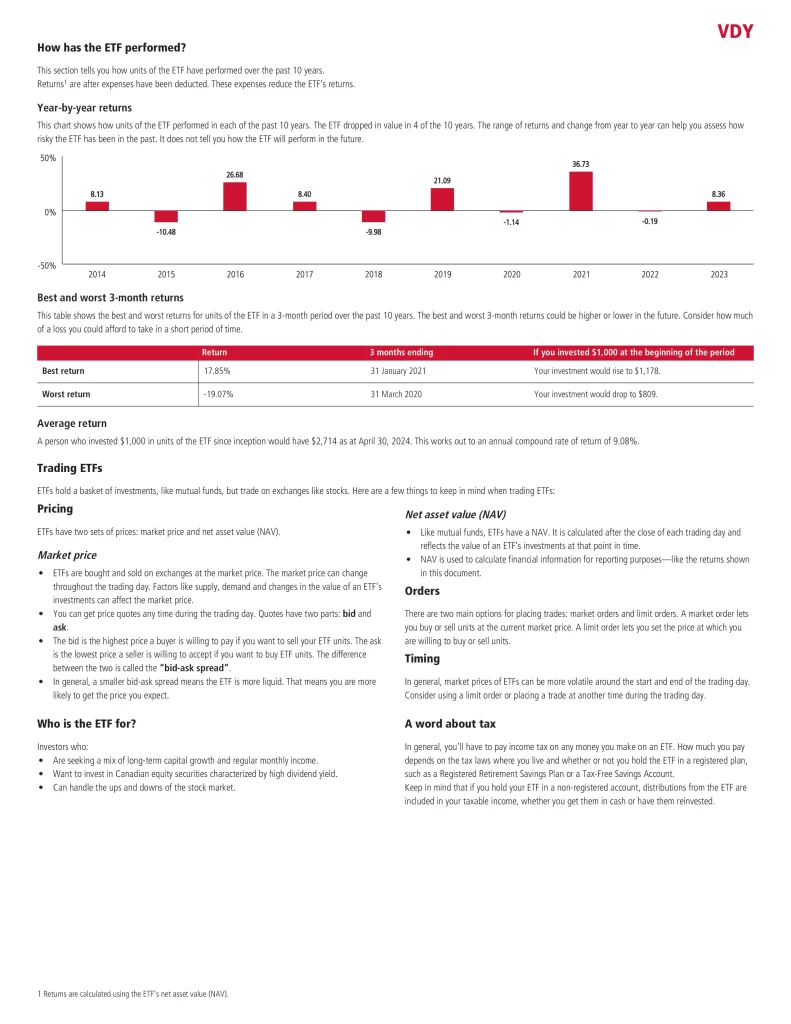
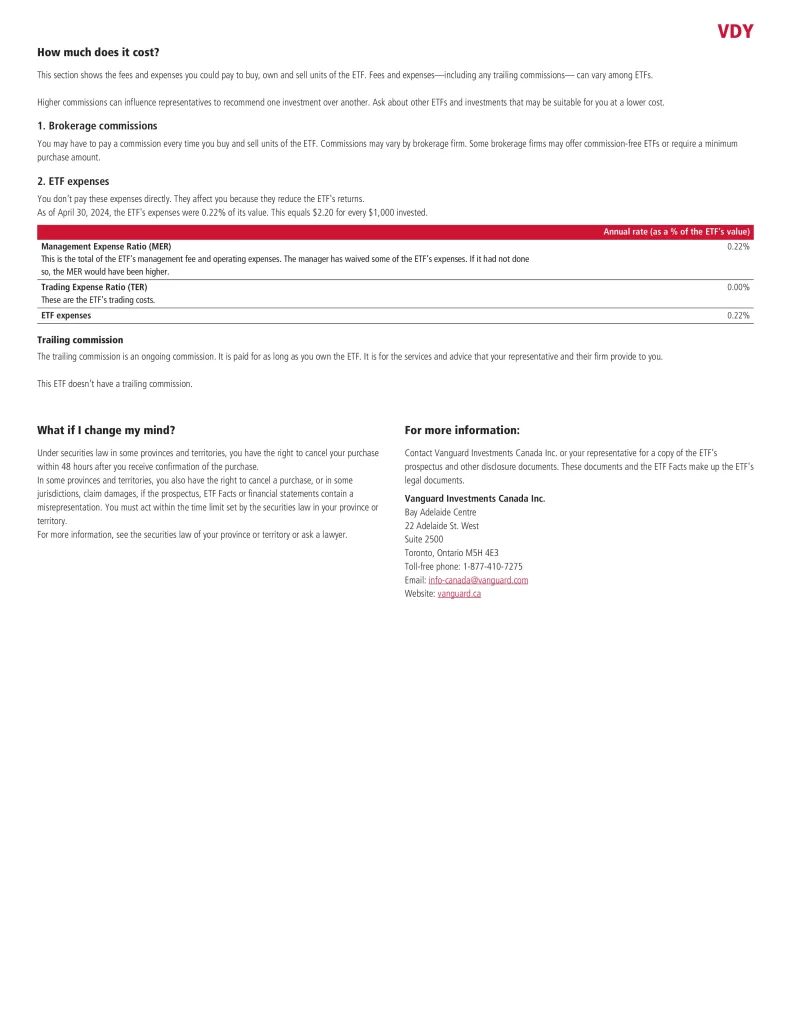
1. Vanguard FTSE Canadian High Dividend Yield Index ETF
Vanguard FTSE Canadian High Dividend Yield Index ETF (VDY) seeks to track, to the extent reasonably possible and before fees and expenses, the performance of a broad Canadian equity index that measures the investment return of common stocks of Canadian companies that are characterized by high dividend yield. Currently, this Vanguard ETF seeks to track the FTSE Canada High Dividend Yield Index (or any successor thereto). It invests primarily in common stocks of Canadian companies that pay dividends.
Do Canadian ETFs Pay Dividends?
Most ETFs pay dividends, but some are solely focused on purchasing Canadian dividend stocks. Using ETFs to target is a practical strategy, providing exposure to dividend investing while maintaining diversification. These dividend ETFs mirror indexes comprised of dividend-paying stocks, employing diverse dividend strategies centred around yield, market capitalization, or geographical location. Publicly traded companies in Canada that pay dividends are heavily invested in the financial and energy sectors. Investors approaching, and in retirement, often favour dividend ETFs for their consistent income, risk mitigation, and inflation hedging.
Which Canadian ETF has the Highest Dividend?
BMO Canadian High Dividend Covered Call ETF (ZWC) is currently the highest Canadian dividend-paying ETF. When these dividends are reinvested it is in 7th place for total return compared to similar ETFs. With the number of Canadian dividend ETFs growing, it’s essential to align your choice with your specific goals, considering factors like investment style, past performance, sector diversity, and fees.
Canadian Dividend ETF Sector Diversification
Below is a sector diversification overview for the leading Canadian dividend ETFs. Given the significant representation of the financial and energy sectors in the S&P/TSX Composite Index, it’s expected that these Canadian dividend ETFs mirror this exposure with considerable weight in these sectors.
| Sector | VDY | ZDV | CDZ | CQLC | FCCD | FLVC | XEI | DXC | HXH | NDIV | PDC | DGRC | XDIV | RCD | TQCD | HAL | XDV | ZWC |
|---|---|---|---|---|---|---|---|---|---|---|---|---|---|---|---|---|---|---|
| Communication | 8.80% | 11.63% | 6.71% | 14.40% | 6.60% | 1.61% | 13.98% | 6.60% | 11.34% | 6.70% | 11.21% | 13.89% | 10.11% | 4.10% | 4.20% | 6.93% | 5.69% | 9.36% |
| Discretionary | 0.10% | 6.36% | 9.67% | 1.70% | 0.00% | 0.00% | 2.57% | 4.10% | 0.00% | 0.00% | 2.06% | 23.34% | 0.00% | 3.90% | 1.90% | 0.00% | 8.97% | 3.15% |
| Energy | 22.70% | 13.70% | 16.57% | 3.00% | 25.30% | 15.72% | 31.00% | 13.80% | 40.24% | 18.90% | 20.12% | 0.00% | 9.87% | 19.80% | 21.10% | 25.32% | 8.07% | 18.37% |
| Financials | 58.30% | 40.59% | 29.47% | 32.70% | 27.90% | 42.52% | 30.26% | 36.30% | 35.21% | 28.40% | 53.60% | 28.59% | 59.83% | 28.80% | 39.00% | 23.60% | 58.19% | 40.19% |
| Health Care | 0.00% | 0.00% | 1.81% | 0.00% | 8.30% | 0.00% | 0.42% | 5.90% | 0.00% | 0.00% | 0.28% | 0.08% | 0.00% | 0.00% | 1.20% | 2.88% | 0.00% | 0.00% |
| Industrials | 0.20% | 8.09% | 10.13% | 9.60% | 7.60% | 14.14% | 0.87% | 10.40% | 0.00% | 10.90% | 0.00% | 24.95% | 0.00% | 13.50% | 3.10% | 18.61% | 1.57% | 10.49% |
| Materials | 0.00% | 6.99% | 4.11% | 0.00% | 4.00% | 0.52% | 1.92% | 7.80% | 0.76% | 9.70% | 0.24% | 9.14% | 8.16% | 11.30% | 11.90% | 6.07% | 3.43% | 7.77% |
| Real Estate | 0.20% | 0.00% | 11.50% | 0.00% | 7.90% | 0.00% | 5.04% | 0.00% | 0.46% | 2.30% | 3.17% | 0.00% | 0.00% | 2.50% | 3.90% | 11.91% | 0.00% | 0.00% |
| Staples | 0.00% | 3.74% | 7.35% | 9.70% | 0.00% | 12.03% | 0.27% | 5.50% | 1.16% | 8.50% | 0.42% | 5.00% | 0.00% | 3.40% | 3.40% | 1.97% | 1.98% | 3.01% |
| Technology | 0.00% | 0.00% | 1.34% | 0.00% | 2.50% | 0.00% | 0.00% | 5.60% | 0.00% | 9.00% | 11.21% | 13.89% | 10.11% | 9.00% | 2.60% | 0.87% | 0.00% | 0.00% |
| Utilities | 5.80% | 12.32% | 9.68% | 19.20% | 9.50% | 12.88% | 13.24% | 2.00% | 10.83% | 5.50% | 9.32% | 0.00% | 11.36% | 3.60% | 1.10% | 4.10% | 11.41% | 7.65% |
Conclusion
Investing in Canadian Dividend ETFs comes with instant diversification in dividends that a single dividend ETF offers. The best-performing Canadian dividend ETF is Vanguard FTSE Canadian High Dividend Yield Index ETF (VDY) which offers superior diversification and reliable income, but it’s crucial to note that not all dividend ETFs are equal. This is an active ETF strategy and has outperformed the passive index strategies in the comparison.


