More information about CI Canada Quality Dividend Growth Index ETF (DGRC) is in its prospectus. Before investing in an Exchange Traded Fund (ETF), it’s important to assess how it fits within your portfolio and aligns with your risk tolerance. ETF prices can also experience higher volatility during market openings and closings and there is always the possibility of losing money. It’s also worth noting that a narrower bid-ask spread generally indicates higher liquidity, meaning you’re more likely to execute trades at expected prices. Always consider these factors carefully when making investment decisions, as even ETFs considered low-risk can experience losses under certain market conditions.

DGRC ETF Review
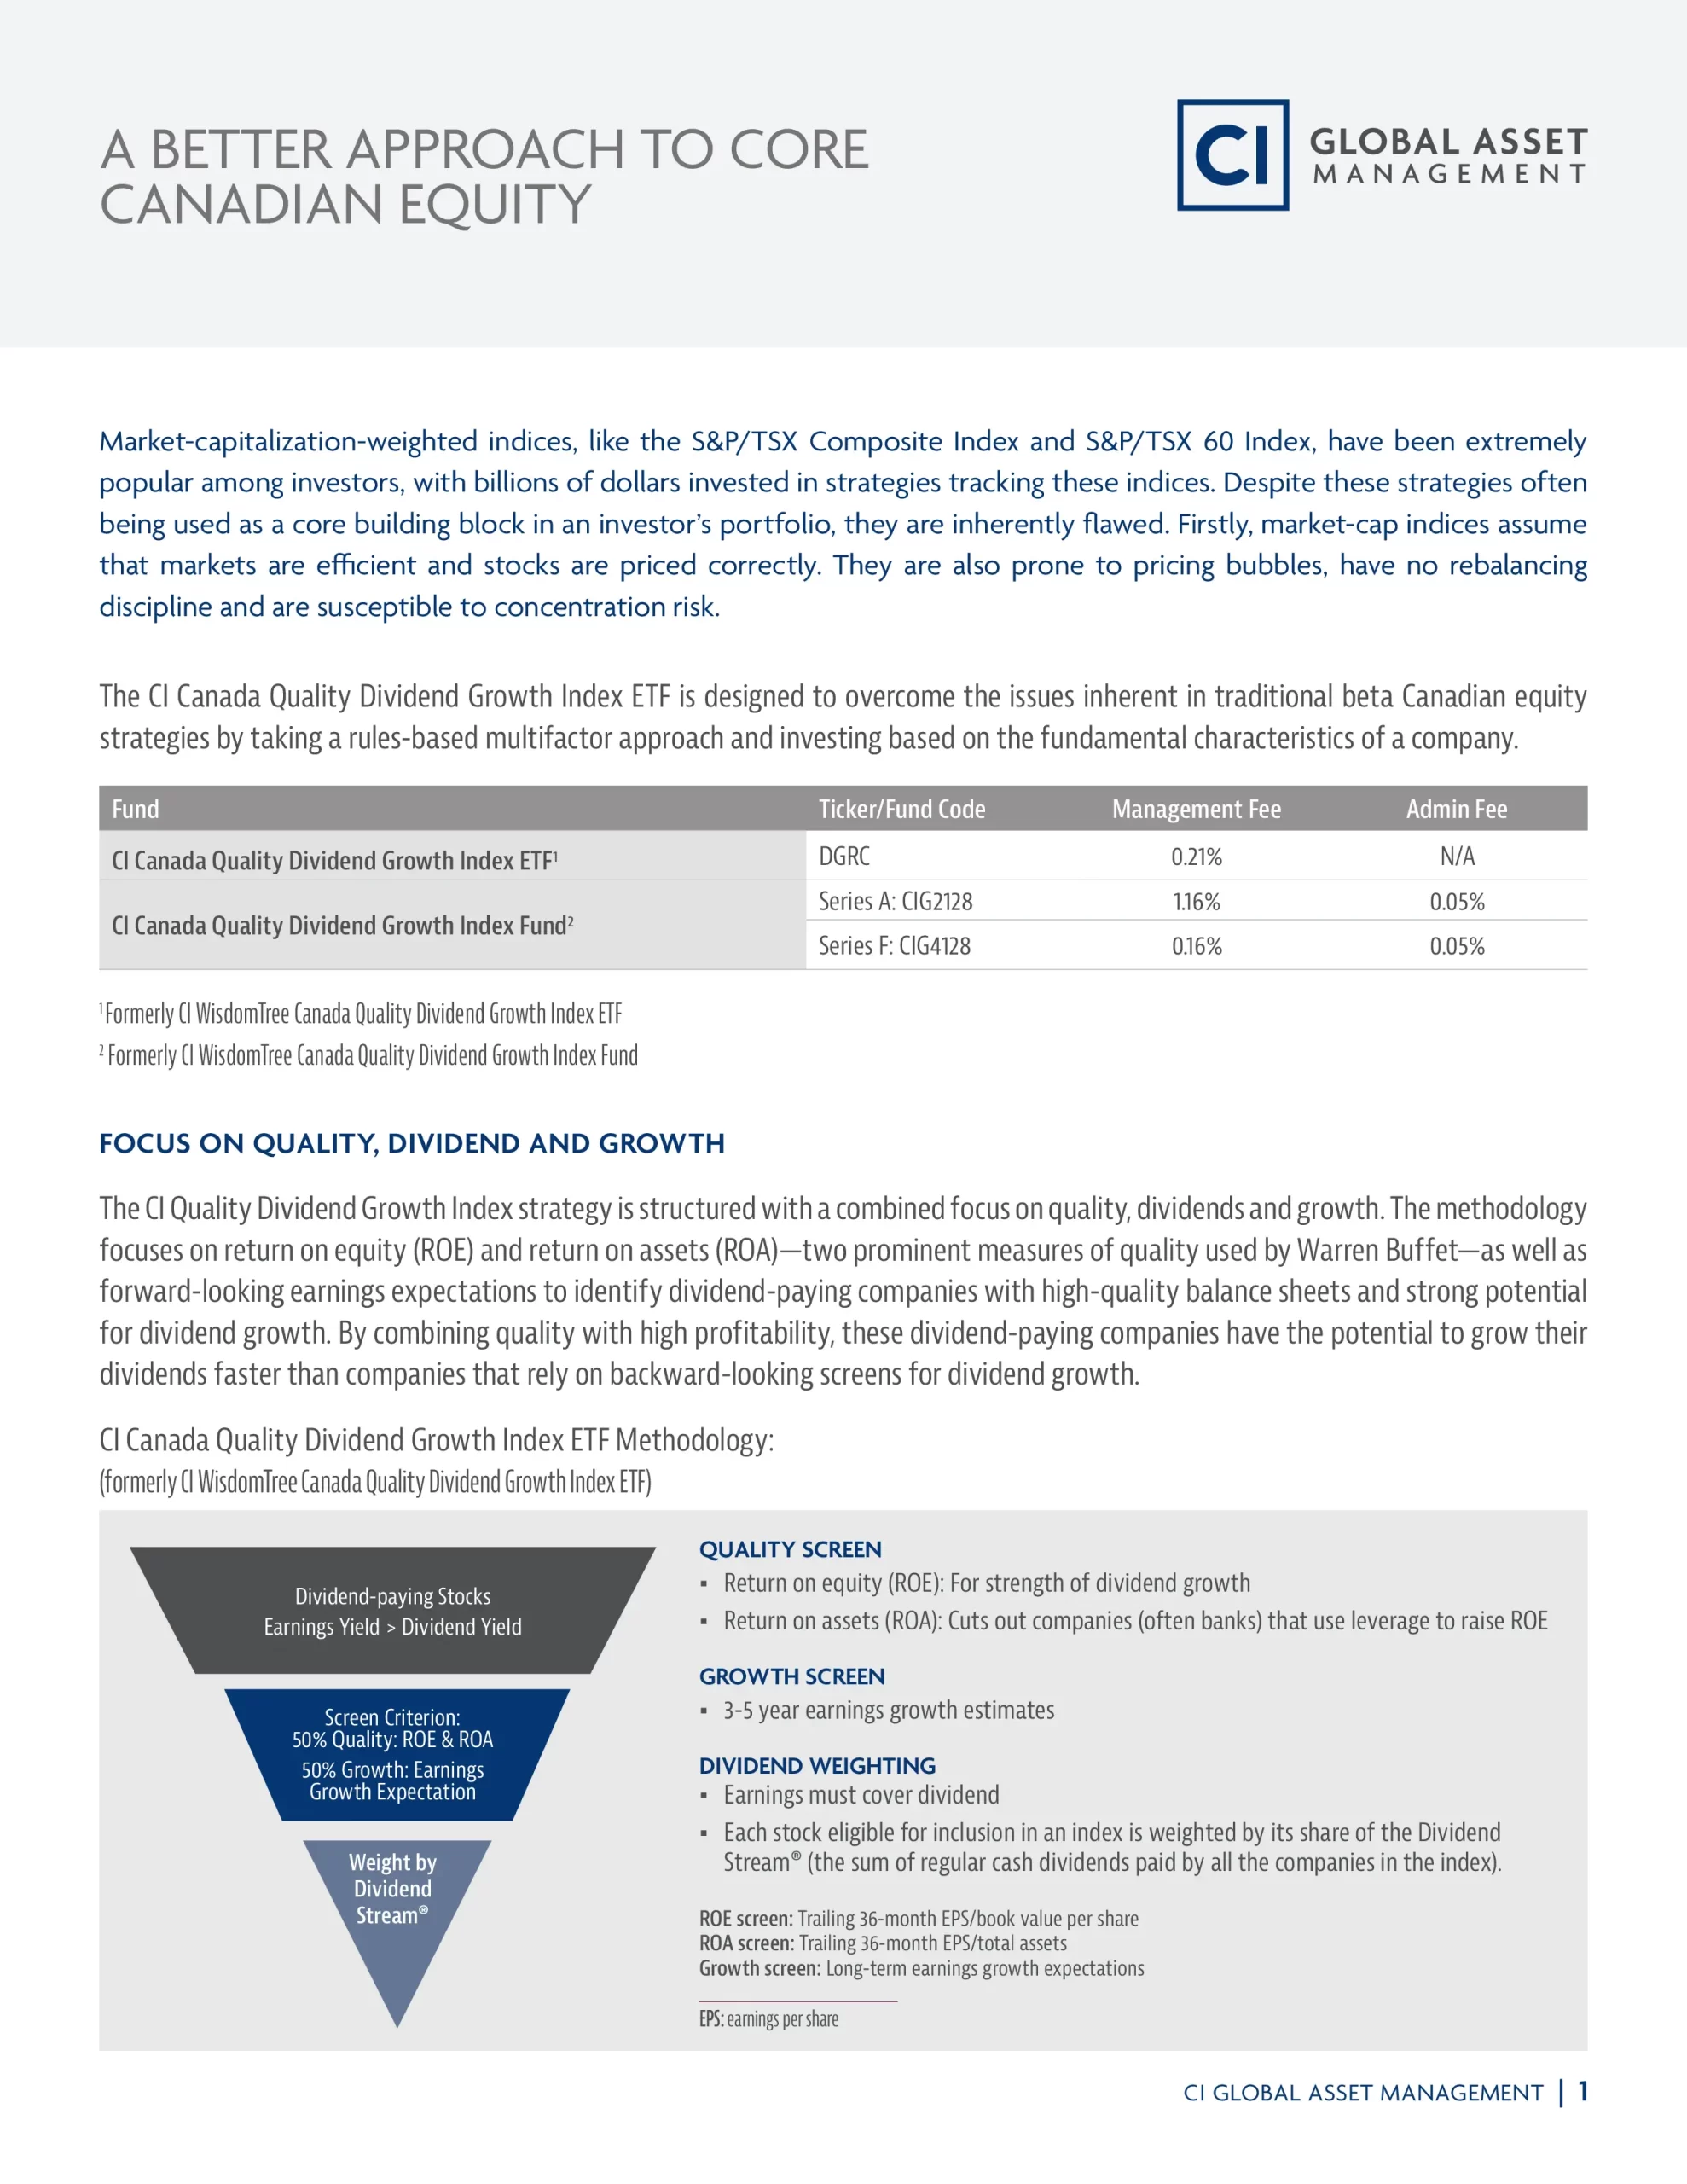
CI Canada Quality Dividend Growth Index ETF (DGRC) seeks to track the price and yield performance of the WisdomTree Canada Quality Dividend Growth Index.
- Want to invest in a broad range of equity securities of Canadian companies
- Can handle the ups and downs of the stock market